Hello!

Welcome to Inqubo. This site is an online journal of Irani Sangham‘s Mphil in Inclusive Innovation at the Graduate School of Business, university of Cape Town.I am currently working at the Western Cape Government as a user experience architect, this has had a large impact on the direction of this study. The focus of my masters was on using design thinking techniques to innovate solutions to creating a digitally inclusive Western Cape, using the Cape Access programme as the use case.

I started this blog when I began my Mphil. and I wanted to capture as much of it as possible. I have added in all the final artifacts produced as an outcome of this programme. The Mphil programme was created primarily to investigate what the methods and tools are to innovate. The programme required a practical approach to partner with the academic thesis.

Here is a list of those artifacts:

  1. Personas
  2. Experience maps
  3. Information architecture
  4. Brand identity and visual language
  5. Wireframes
  6. Detailed designs
  7. Interactive prototype
  8. Alignment diagram
 

Alignment diagram
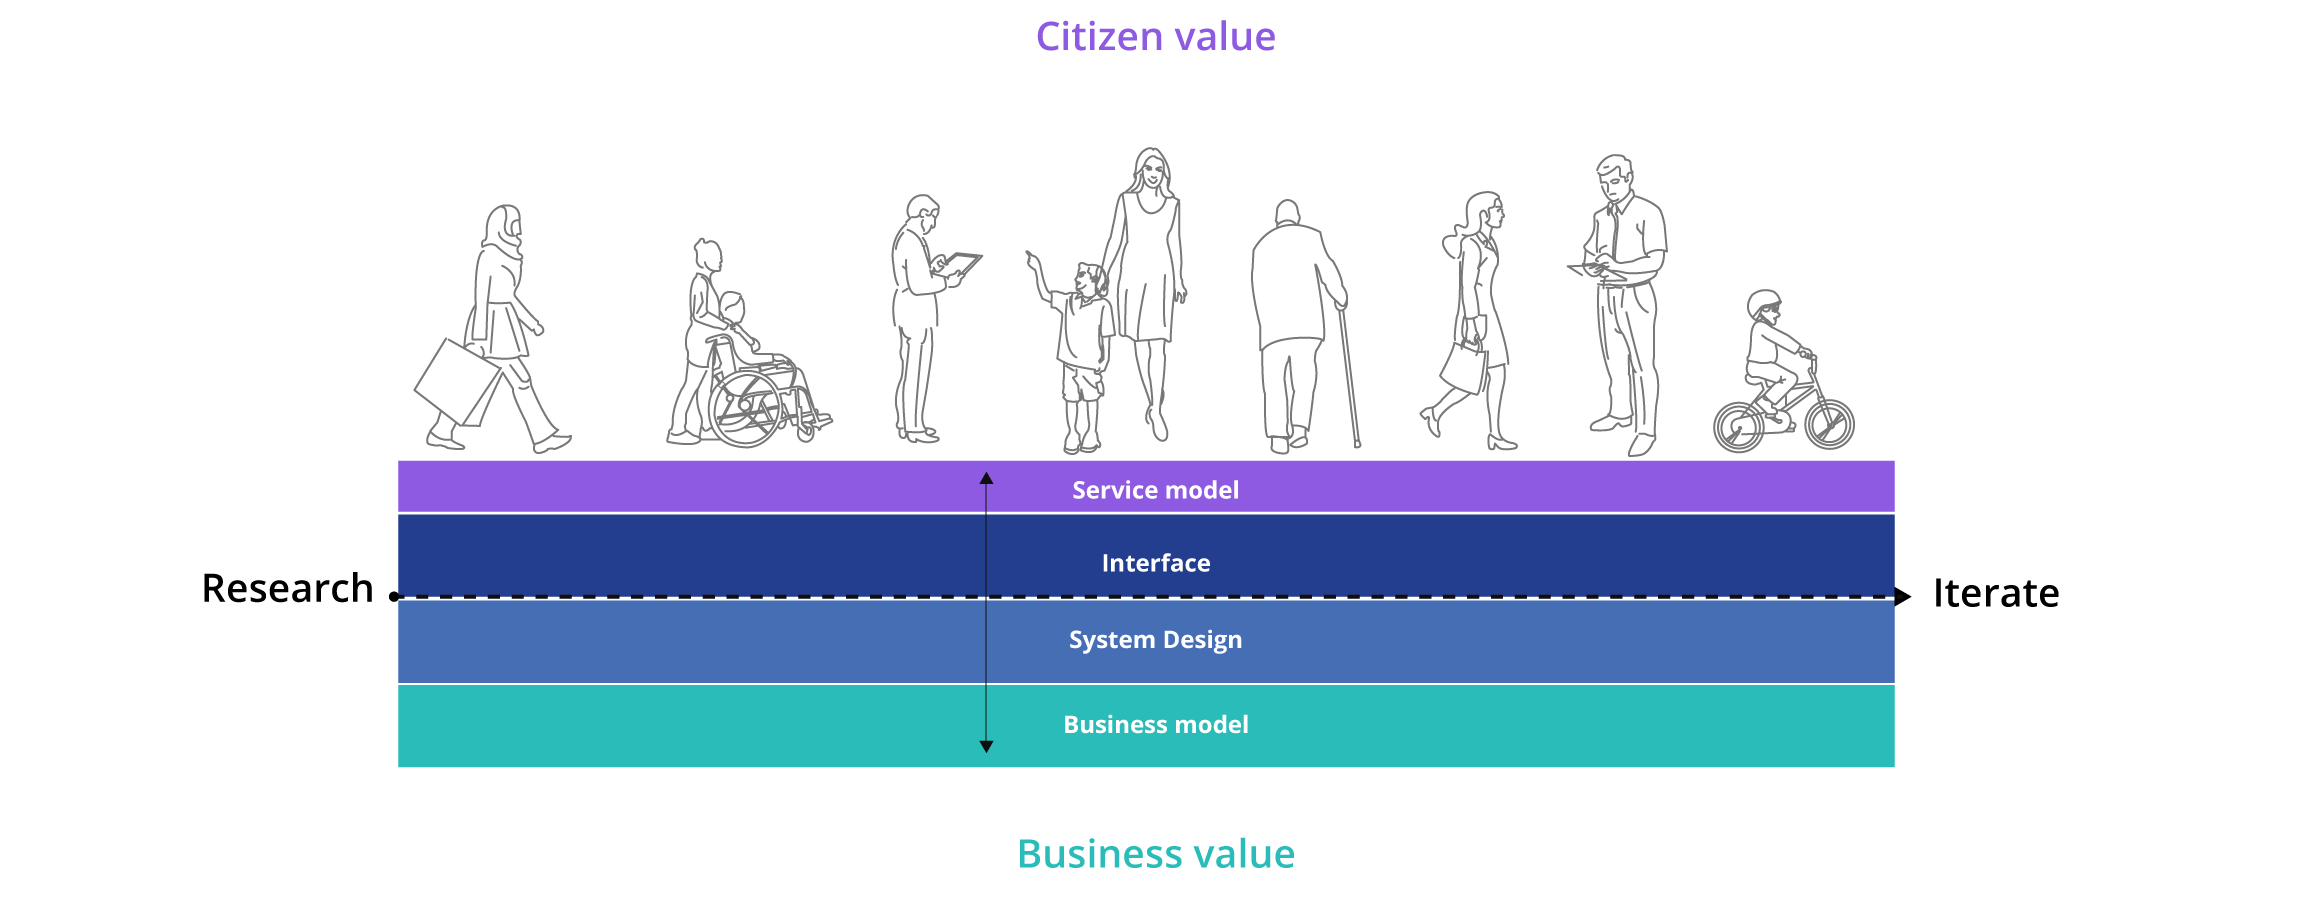
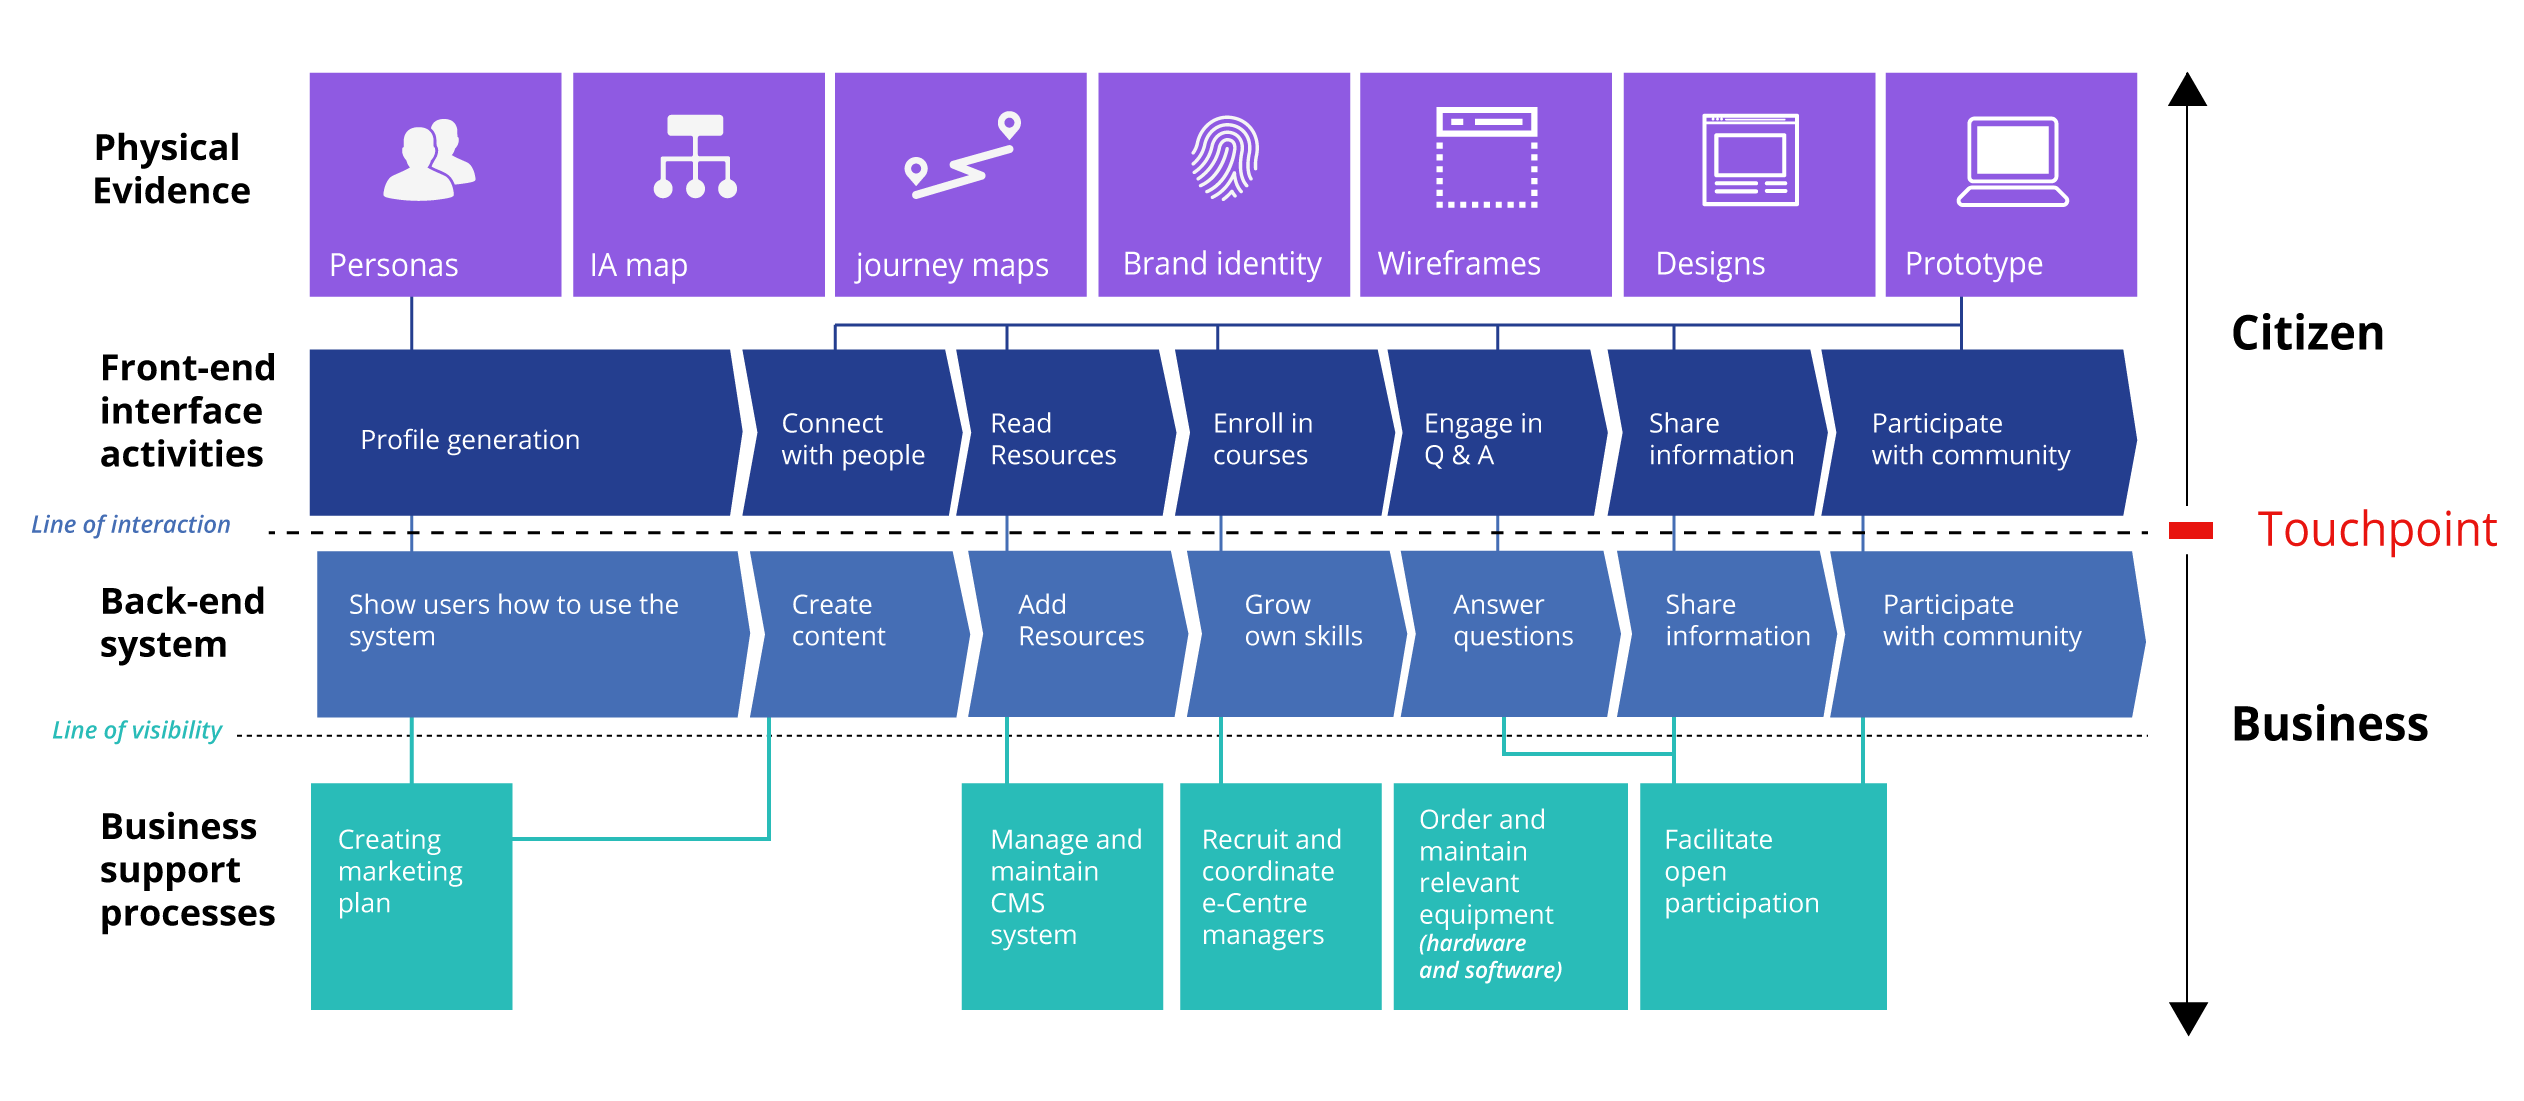
After all the artefacts were created, I revisited the alignment model that was created at the beginning of this research endeavour.The alignment model was created to illustrate how business and citizen value must align in order to create a value-creating system for the humans involved. The second diagram describes how this model has been applied in this research by explainging how the different layers contribute to different areas of the service provided.
alignment-model alignment-diagram
Prototype

This is the first iteration of the interactive prototype that was created.

Cape Online prototype.

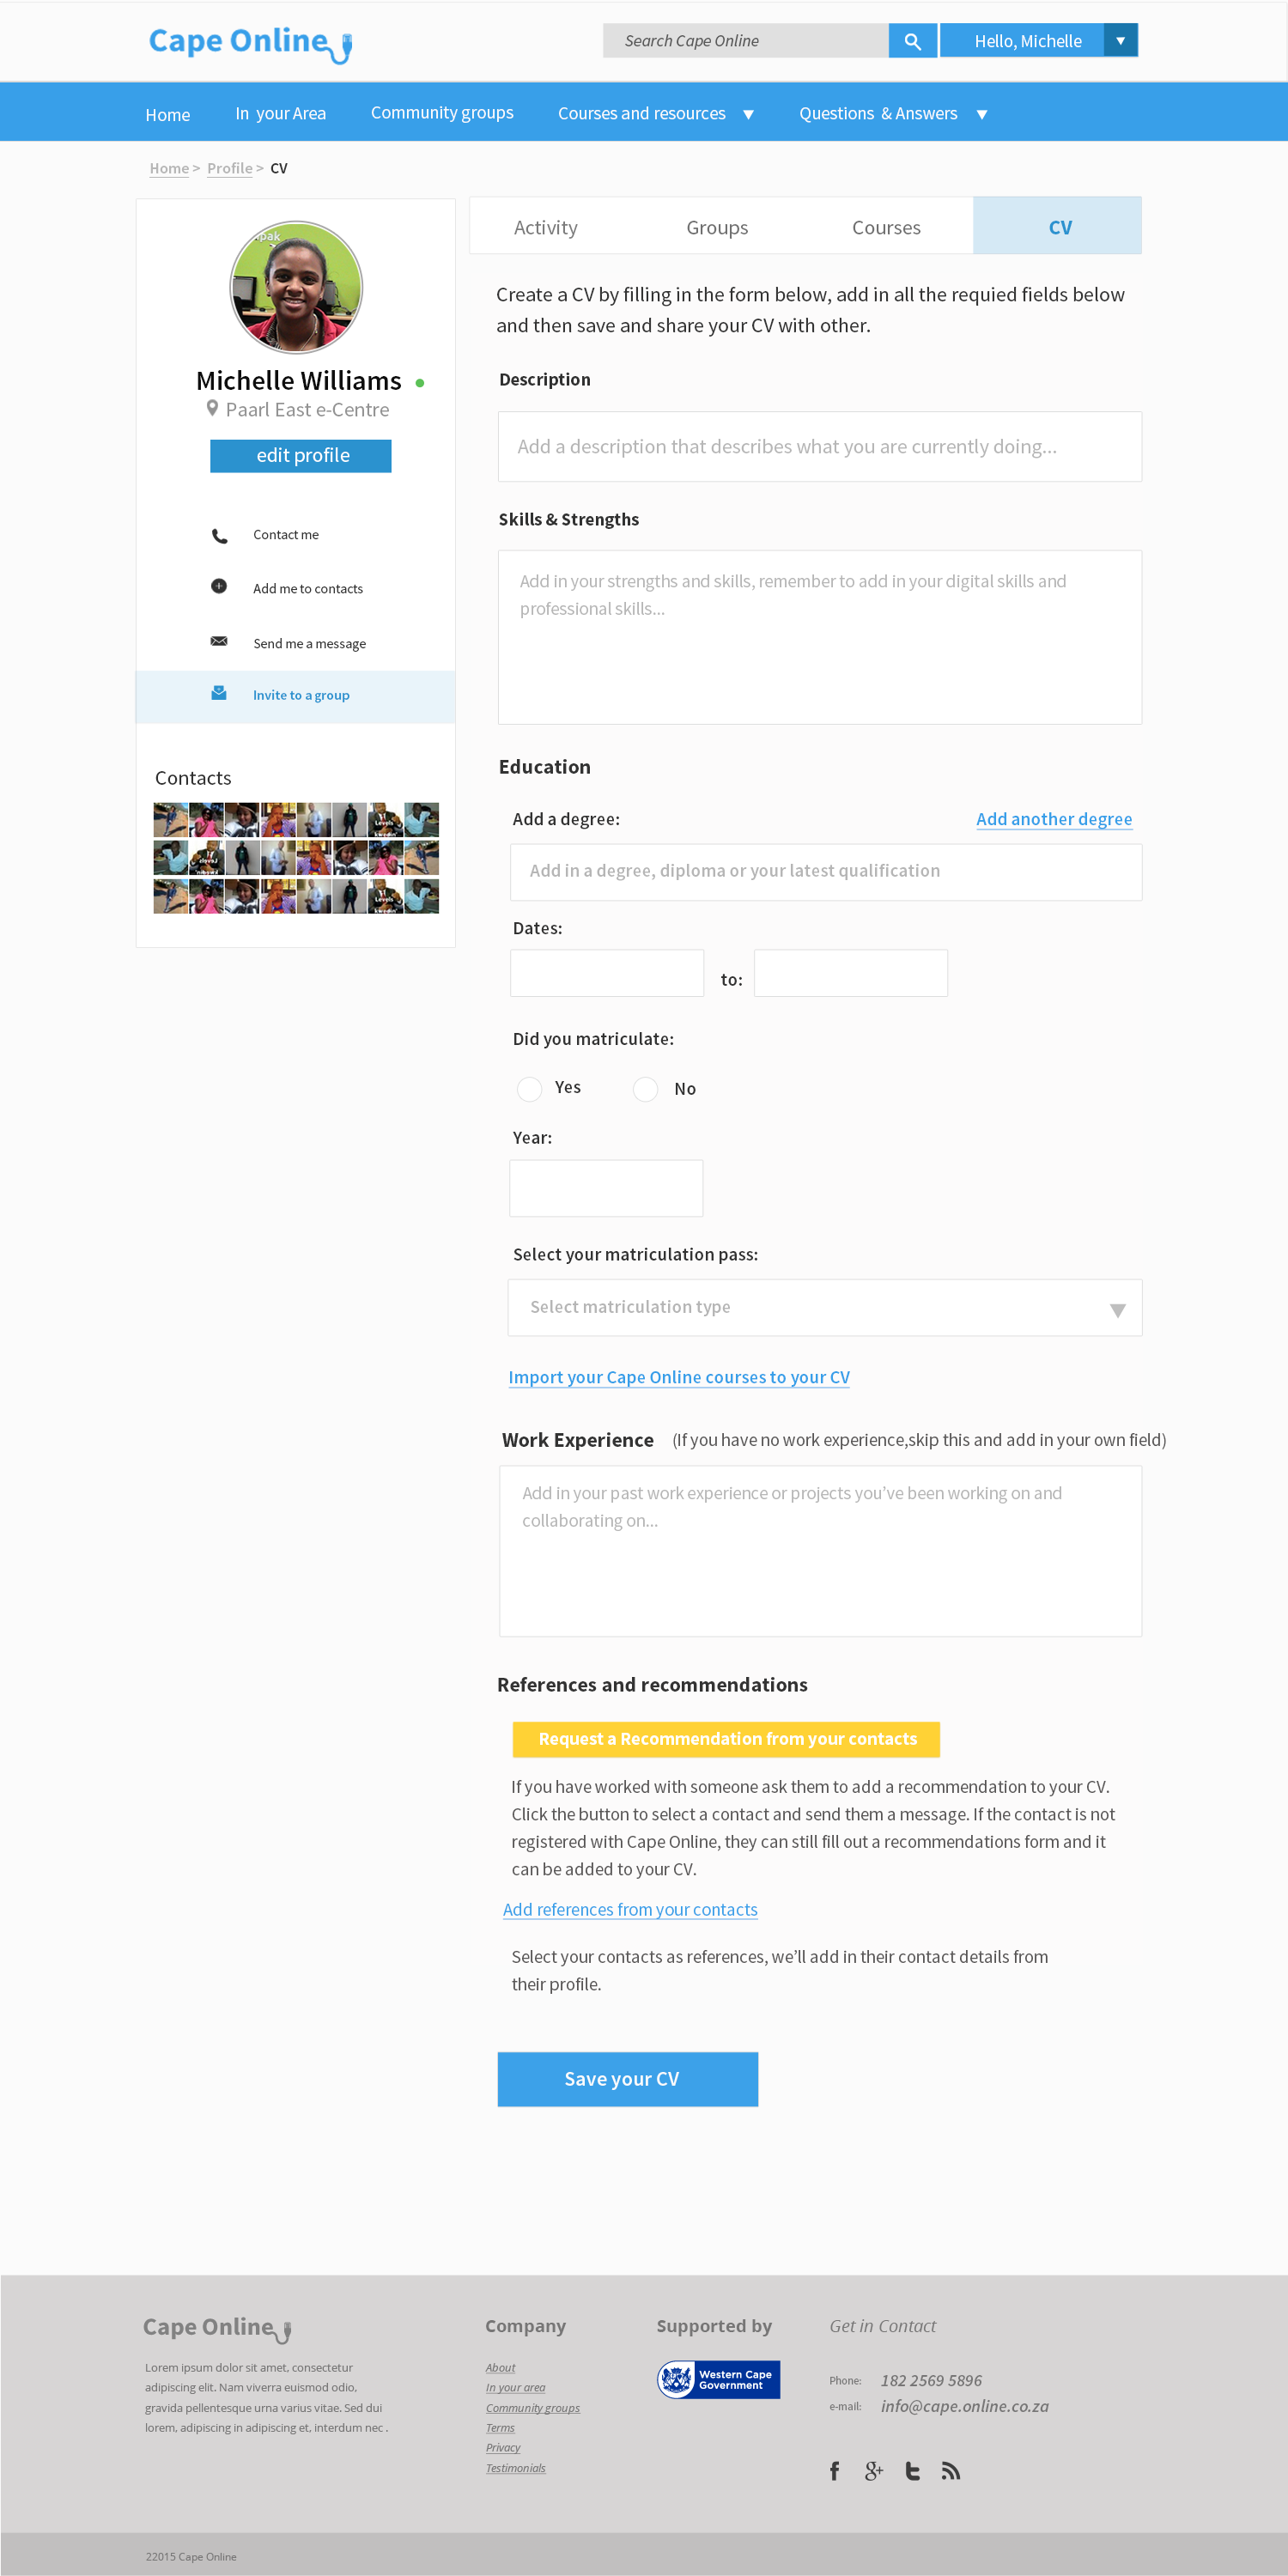
This was the final version that was tested with potential real end users of this system. It is a prototype, so it is not perfect. The main focus of this interactive was to test the CV section of the prototype. How can we create an easy way for users to create a CV that works for them and is easy to use and navigate through?

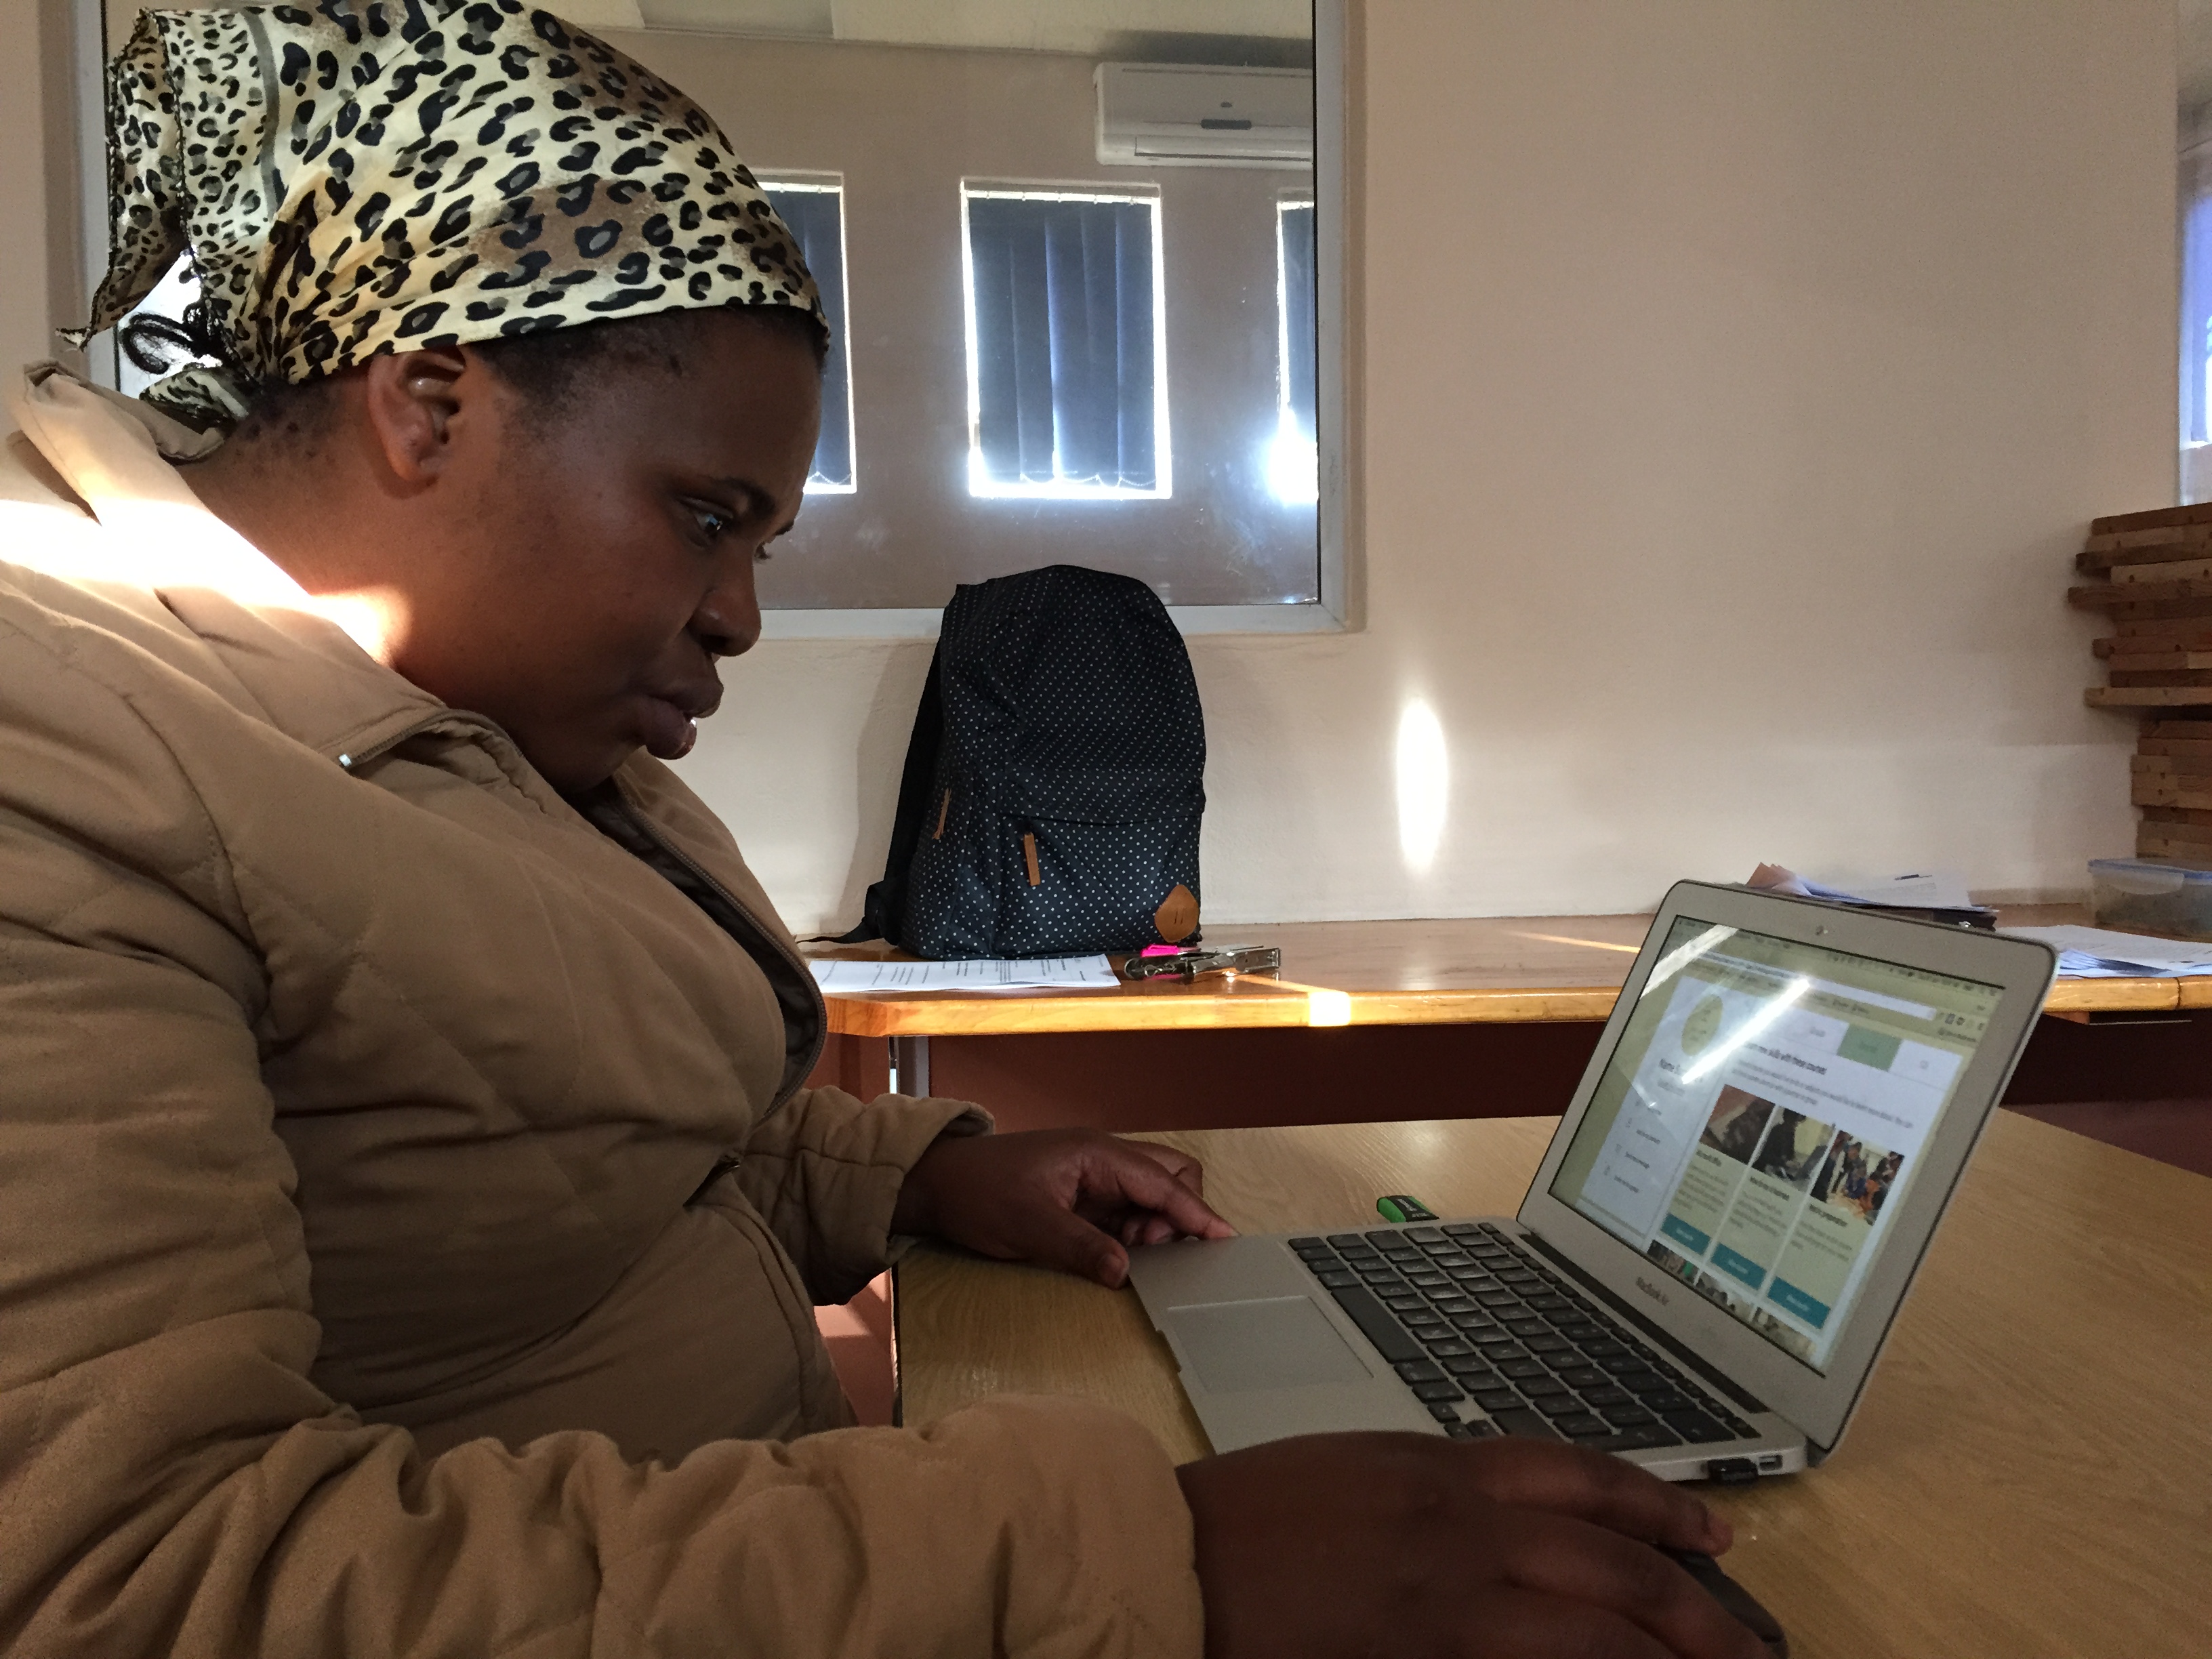
I conducted tests with the users who I based the persona archetypes on, I tested the interface with a user from each persona type.

IMG_1563


IMG_1575

This prototype was created in UXPin, therefore it might load a bit slower than a normal website.

This is what the create a CV page looks like

This is what the final CV page looks like.

You can navigate the top menu items and look through the rest of the site too.


Detailed designs


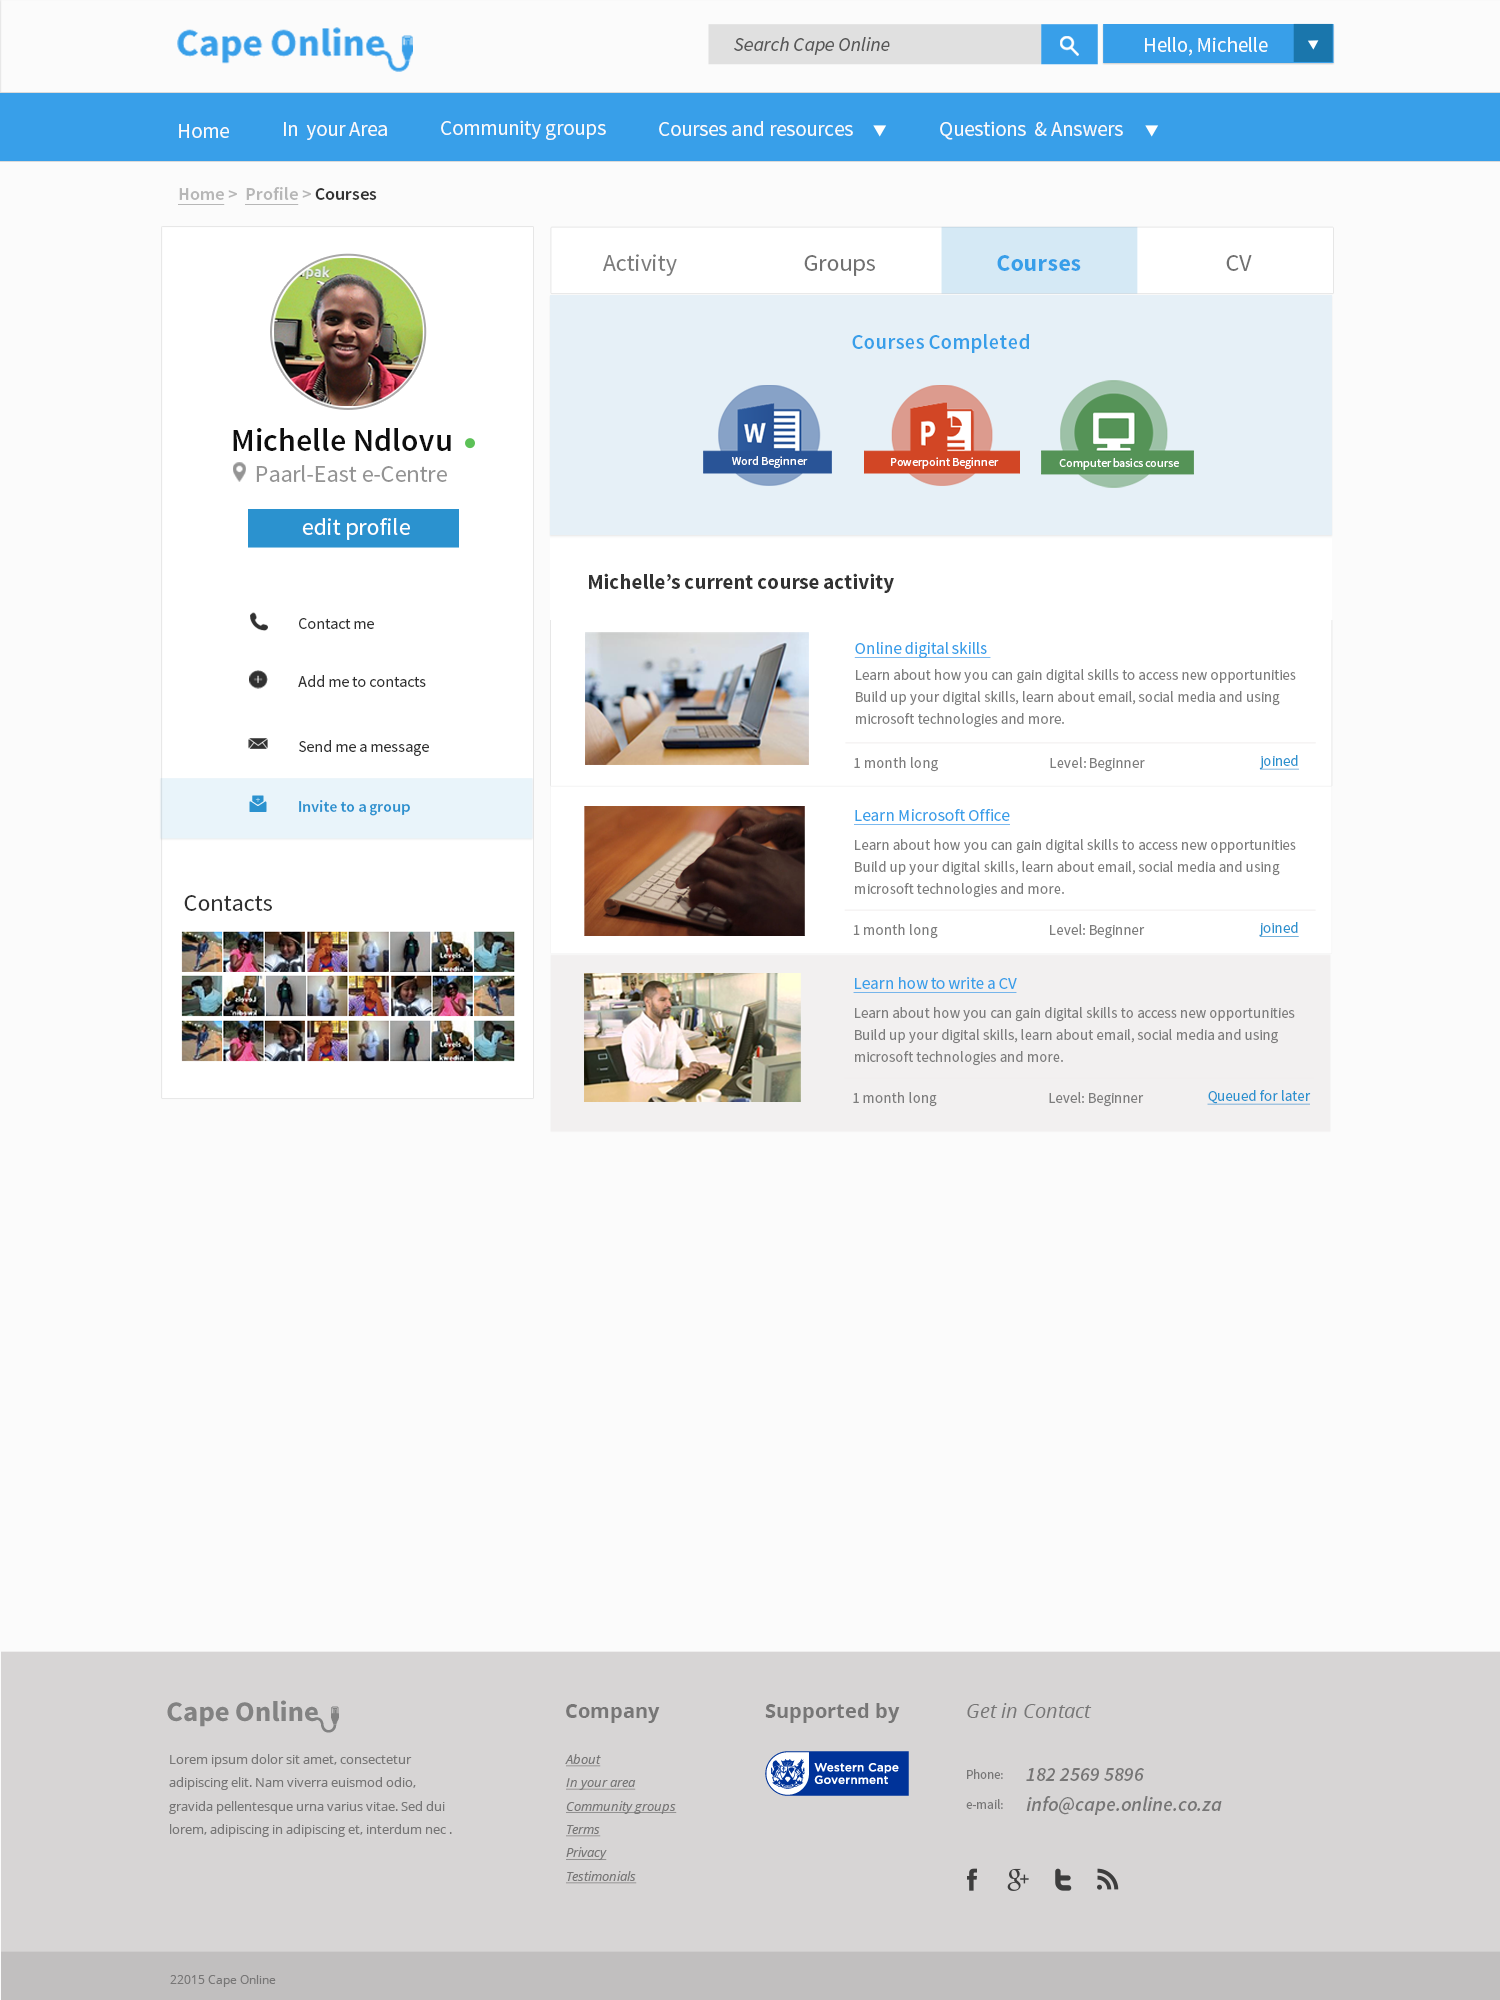
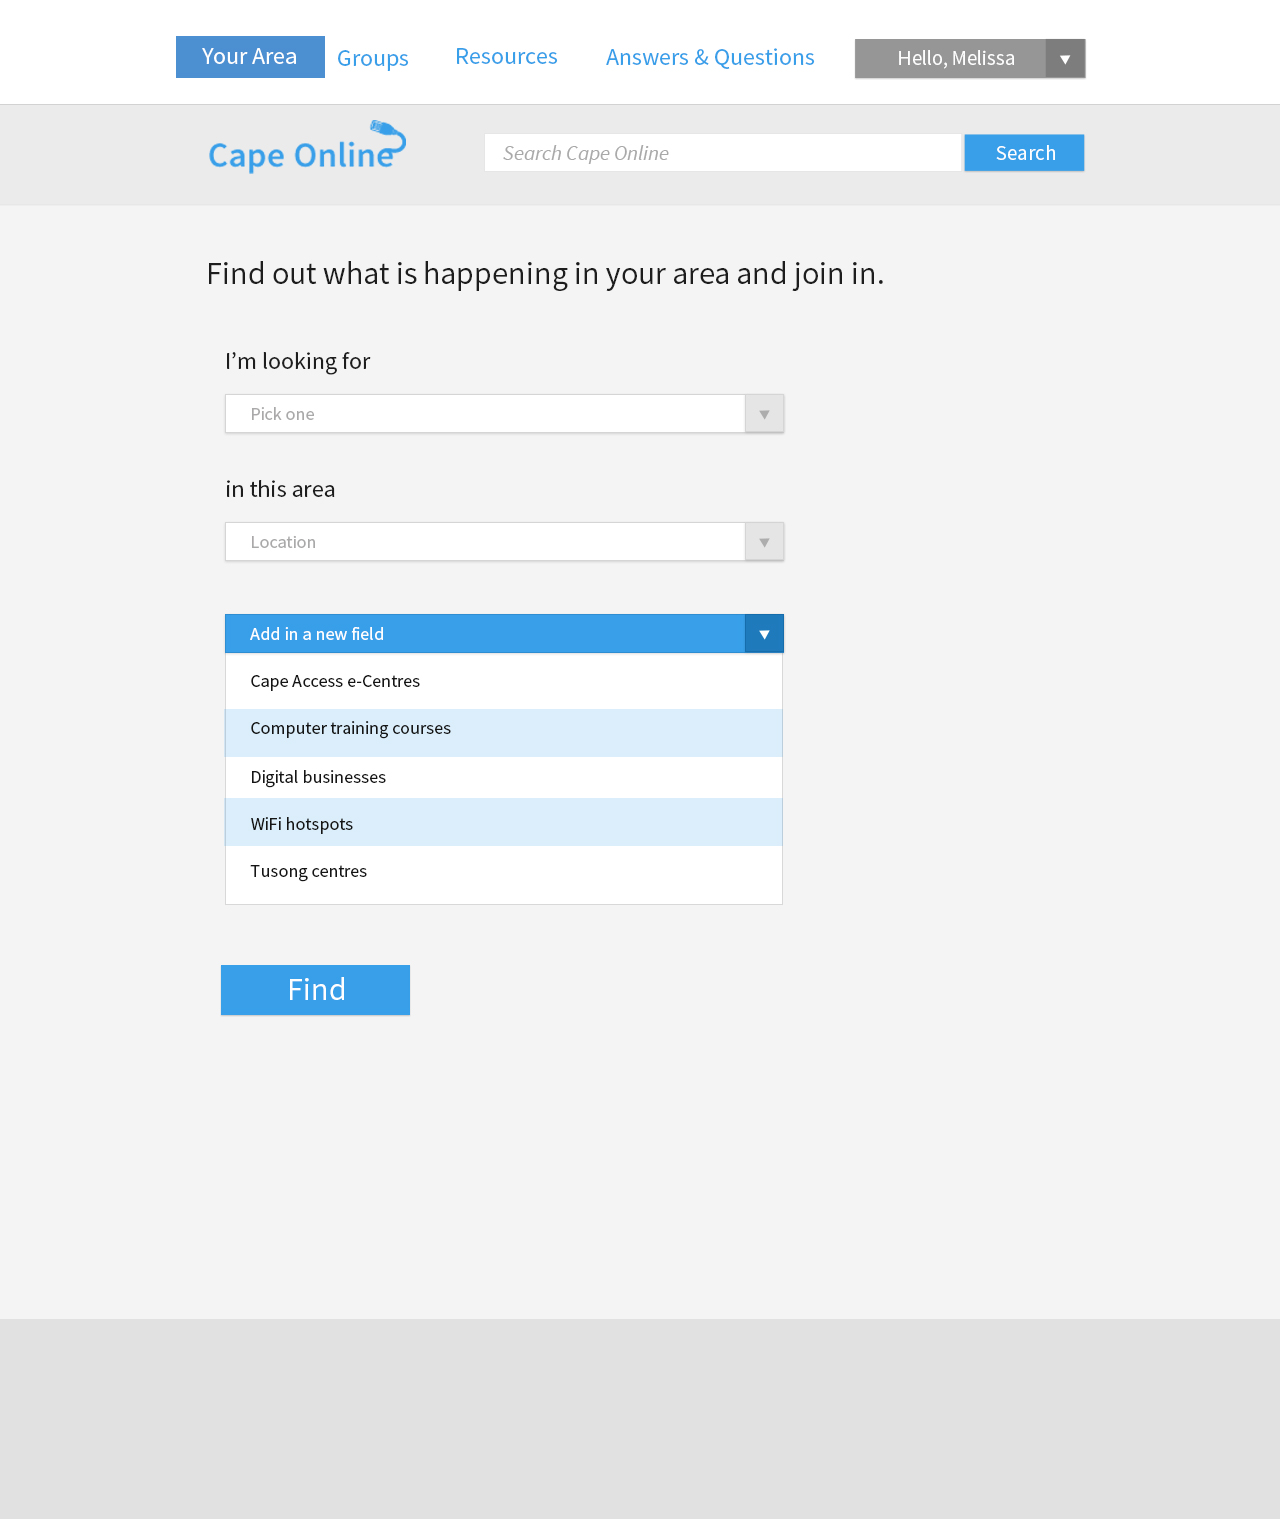
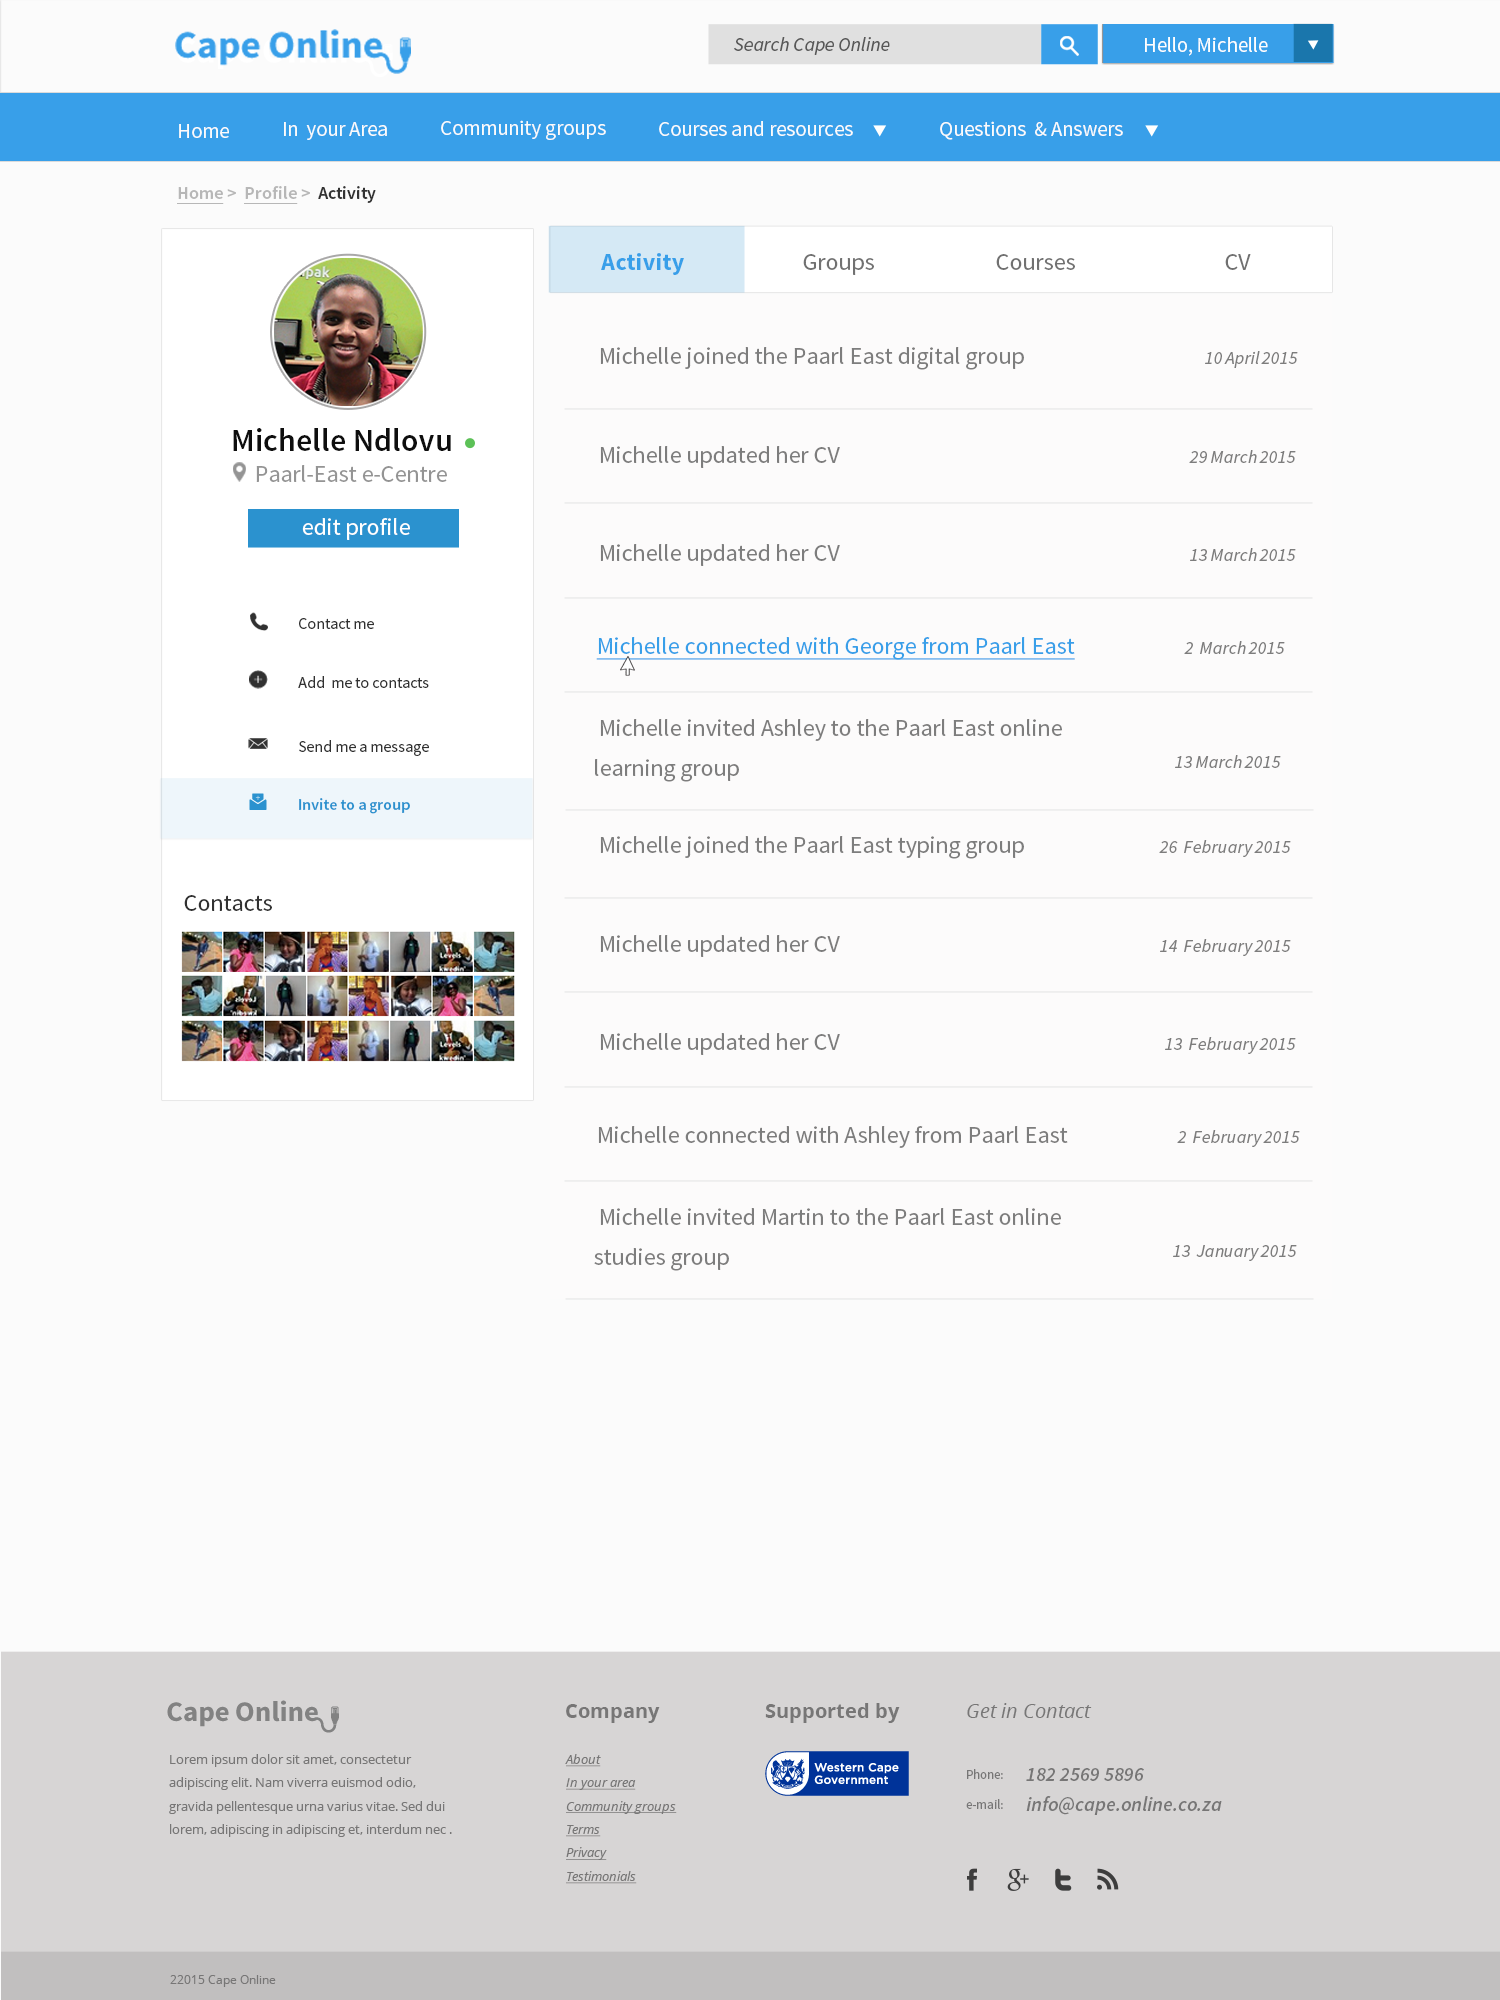
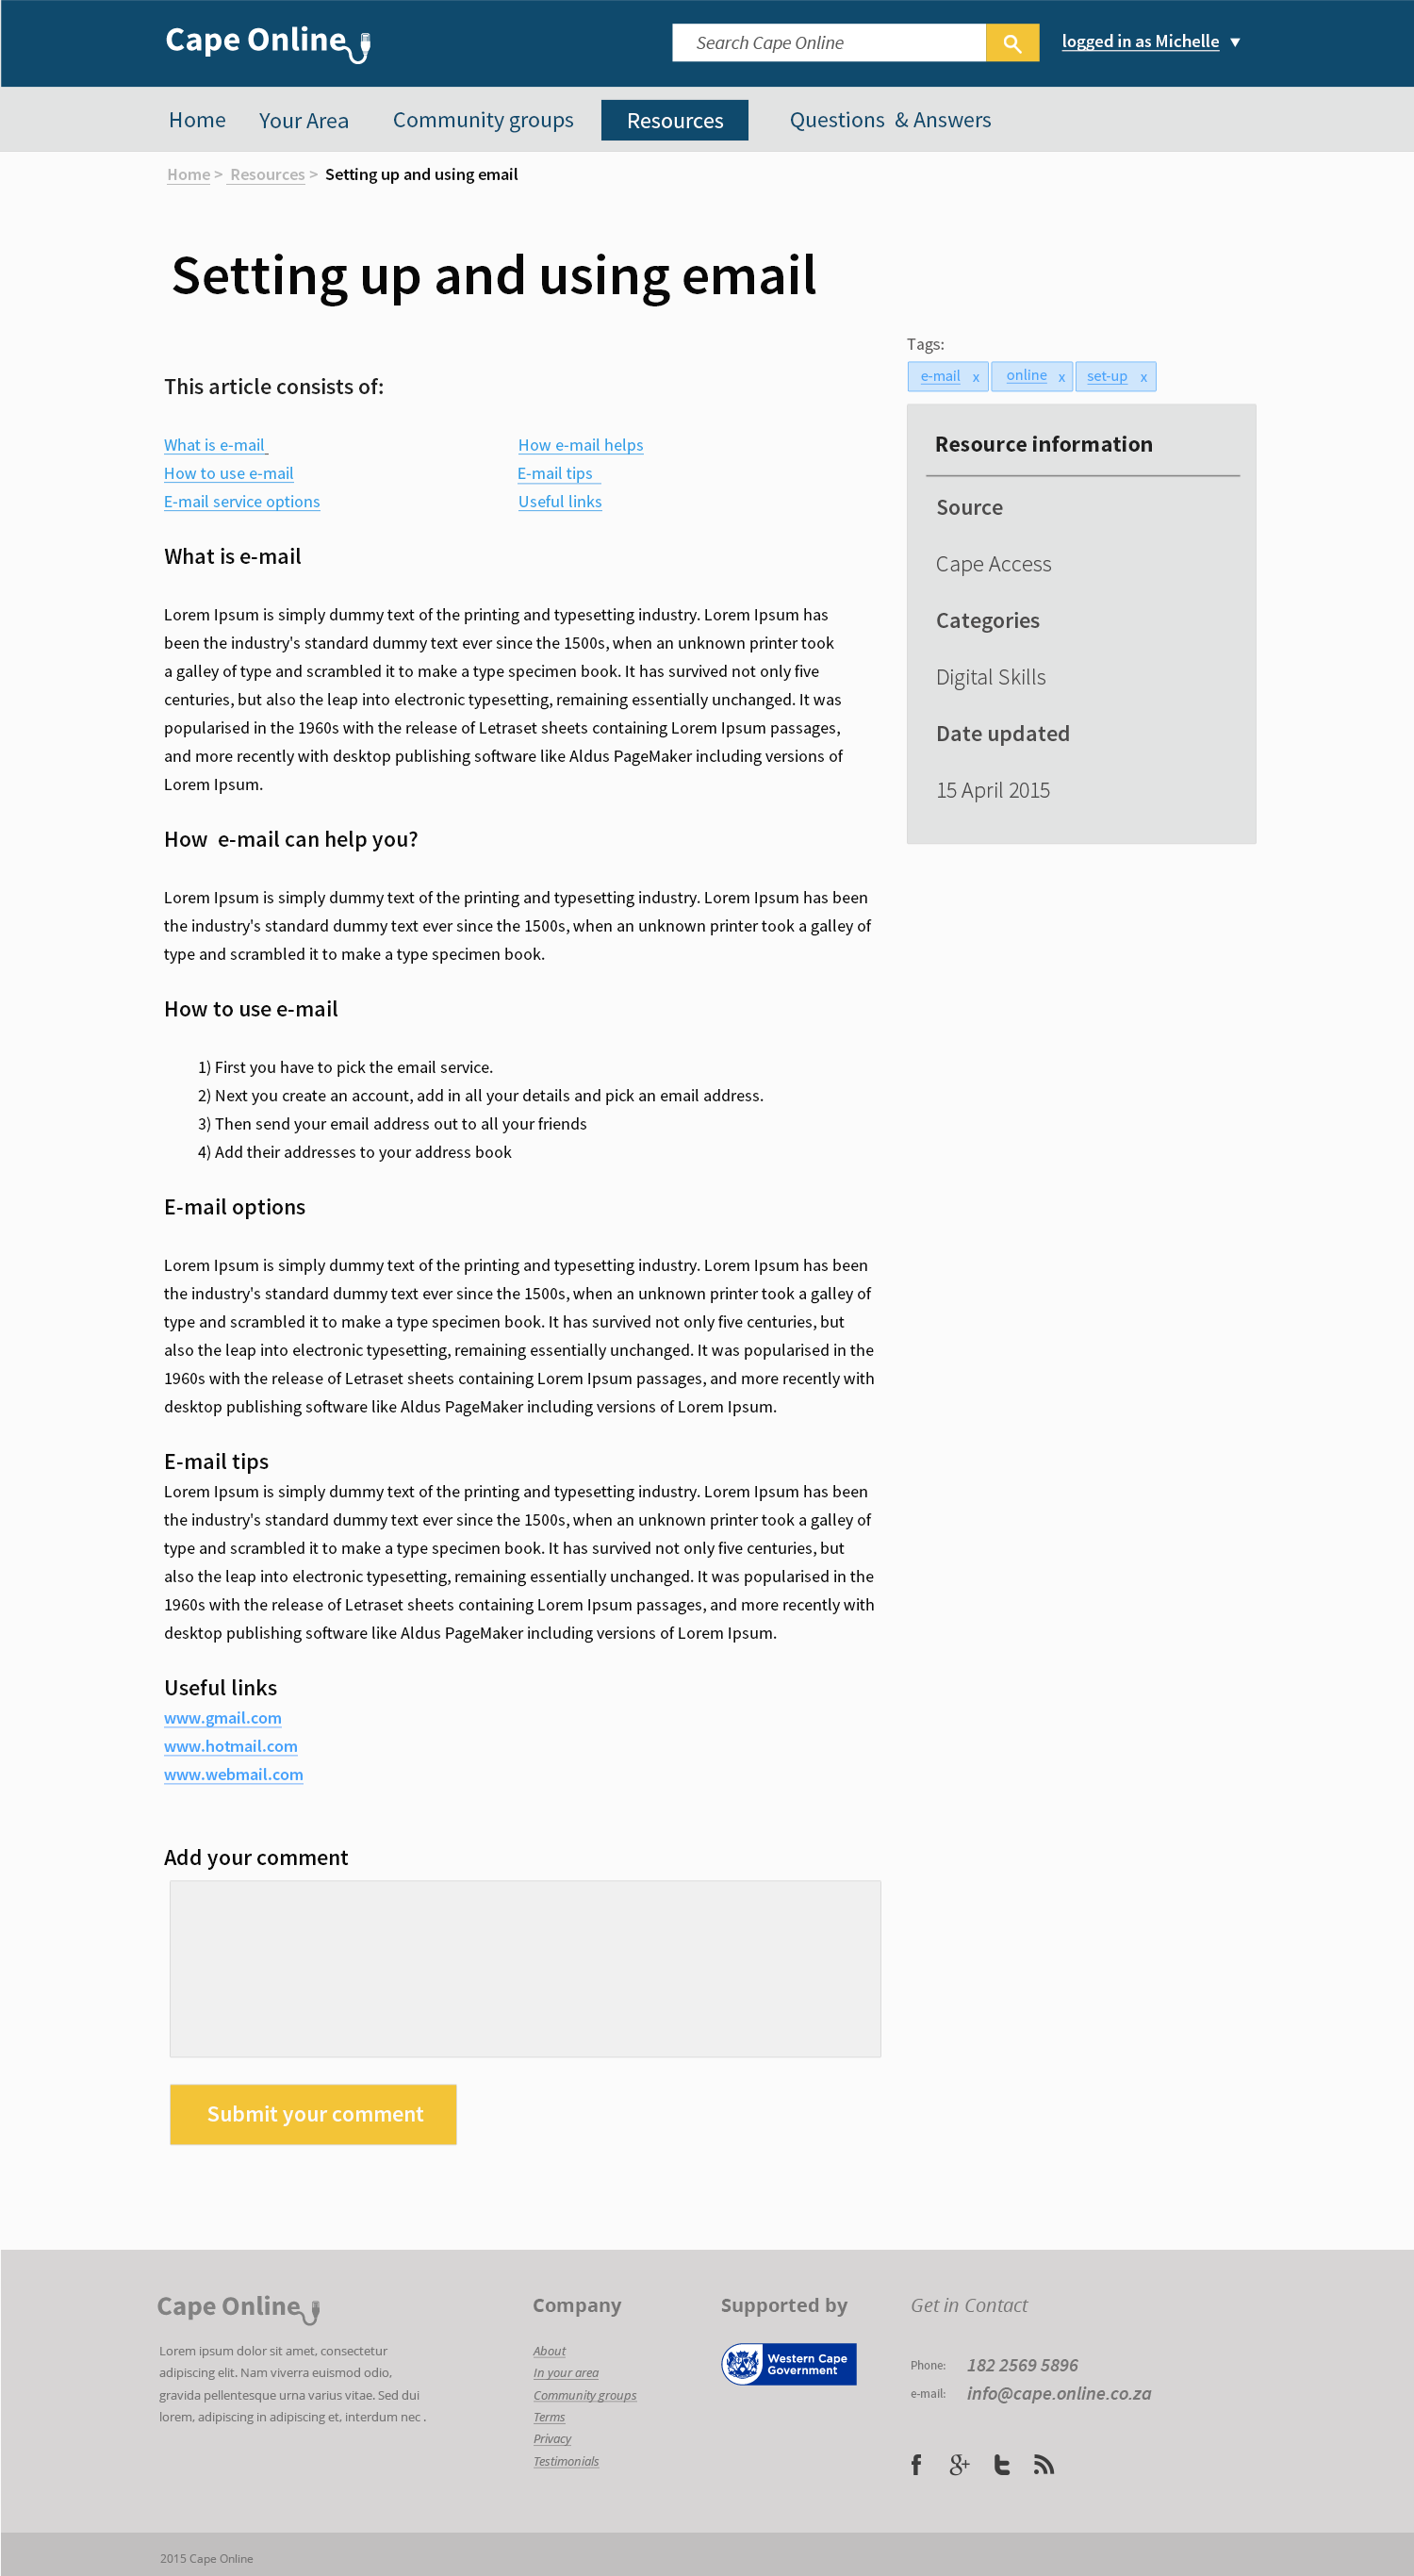
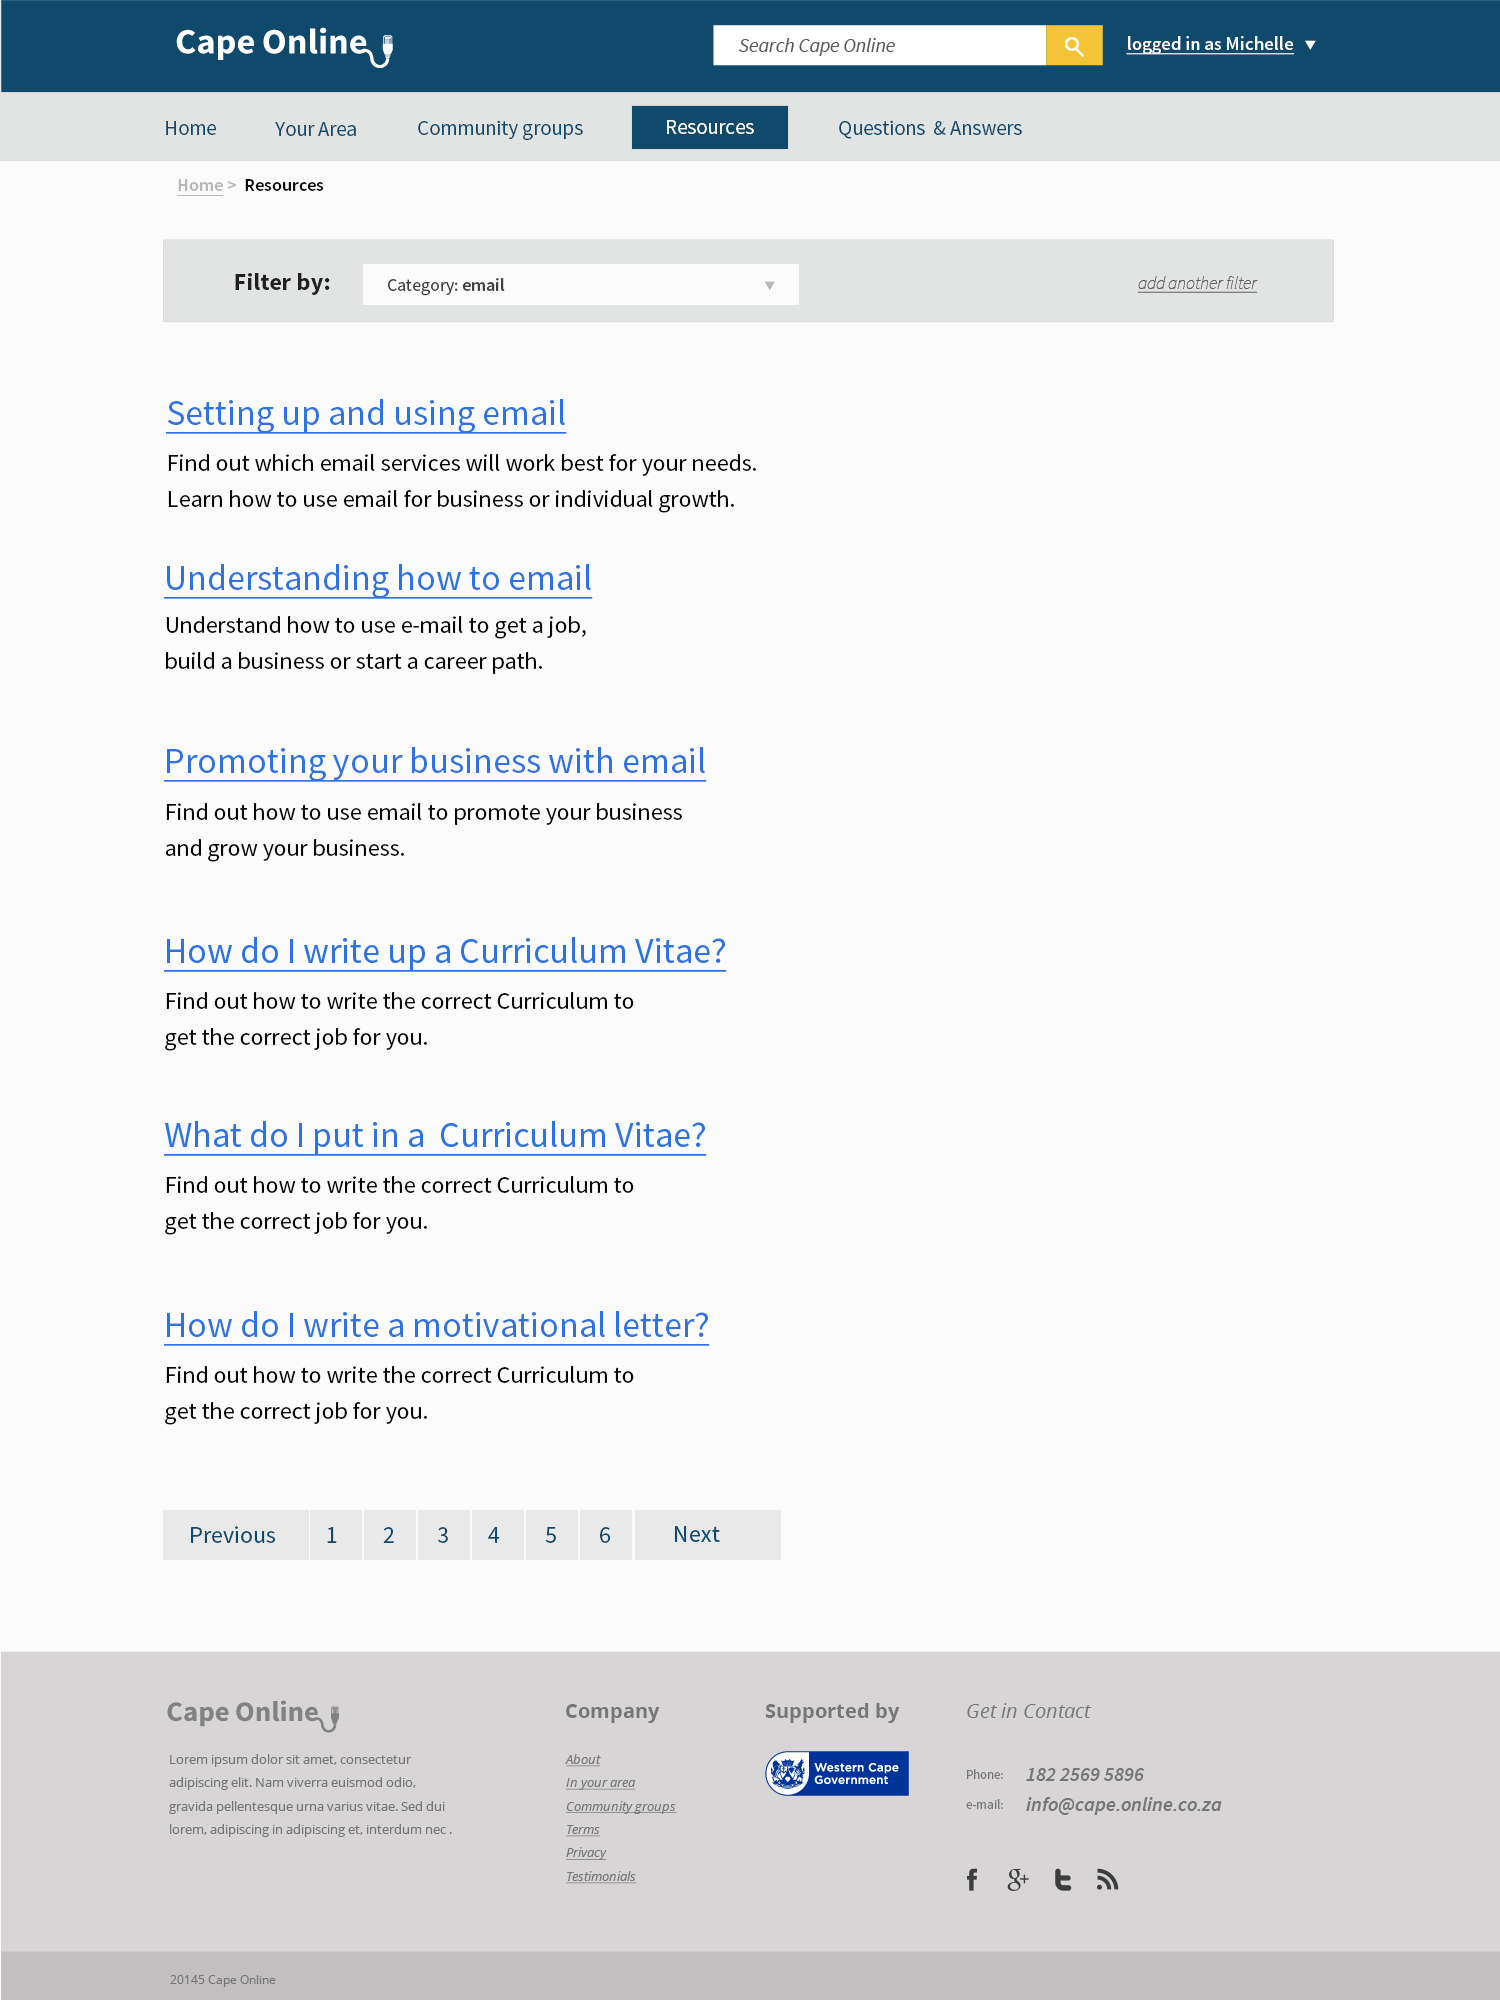
Below are some detailed designs that I designed. At this stage I was exploring the possible design elements, such as how to assemble the visual language elements into relationships that work well together, there are different designs that showcase this below.


05-CapeOnline-profile-cv-form


03-CapeOnline-profile-coursesCapeOnline-QA-categories


CO_your-area CO_your-area02 CO_your-area03


01-CapeOnline-profile-activity

CapeOnline-Resource CapeOnline-ResourcePage-email

Wireframes

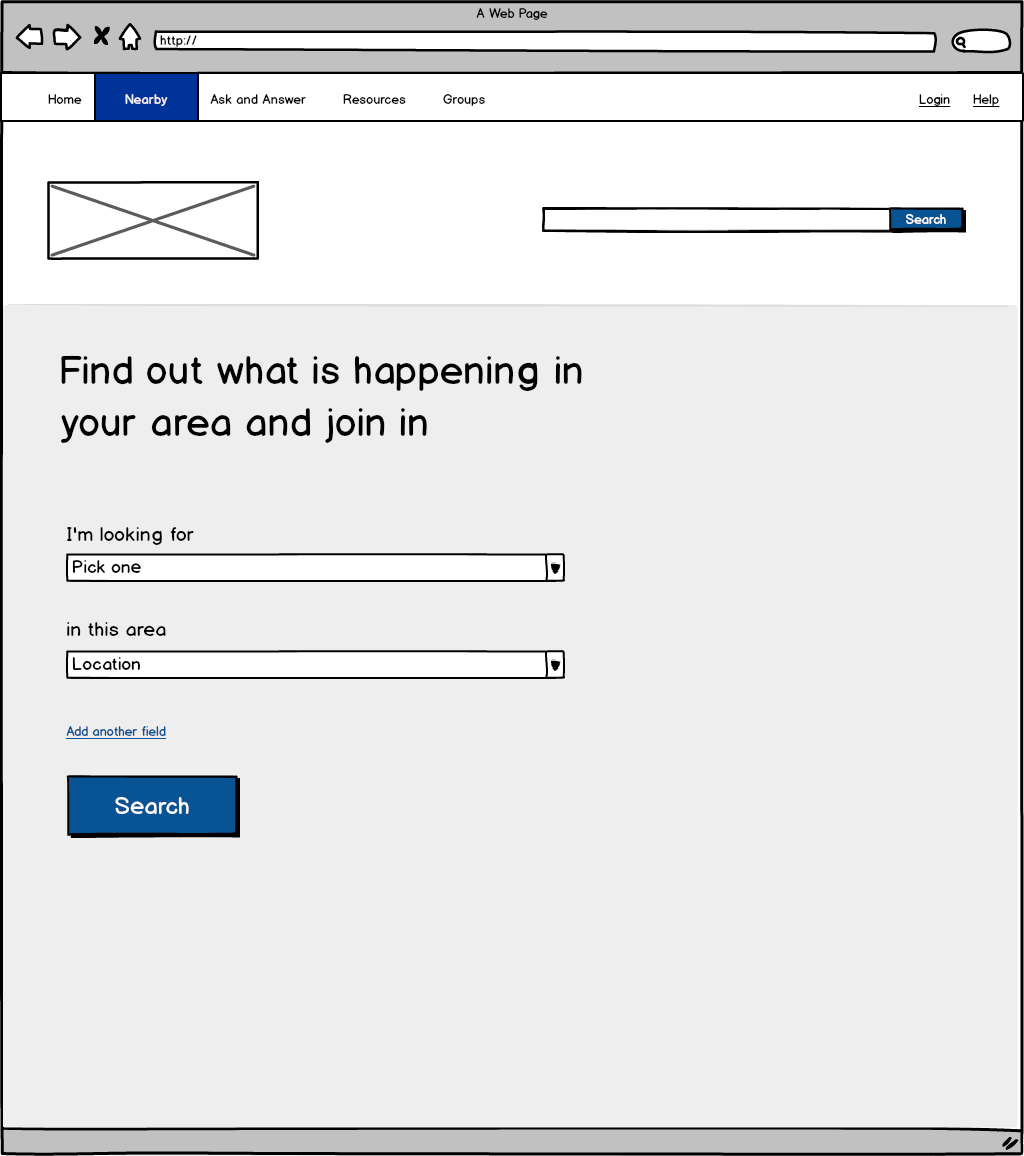
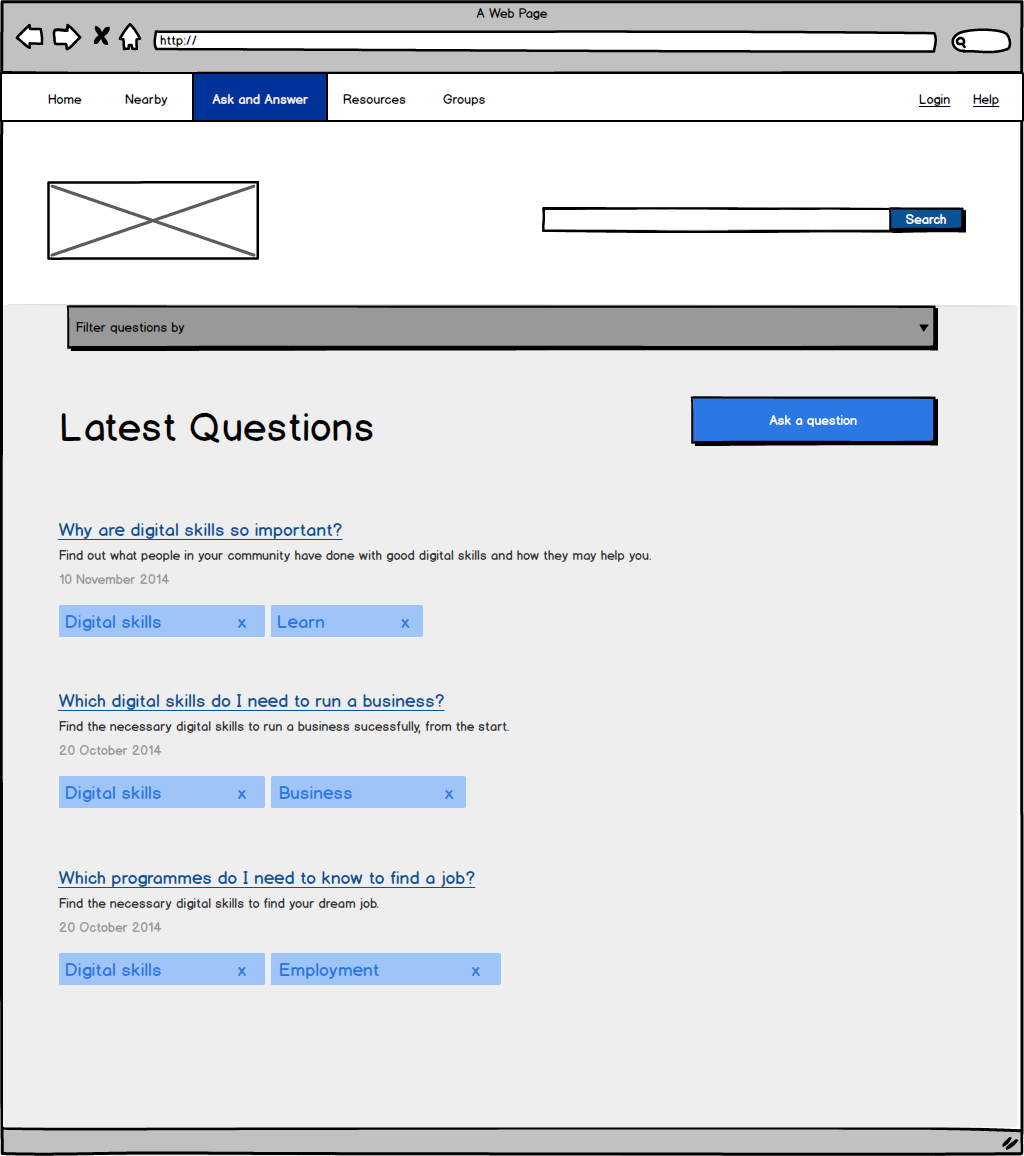
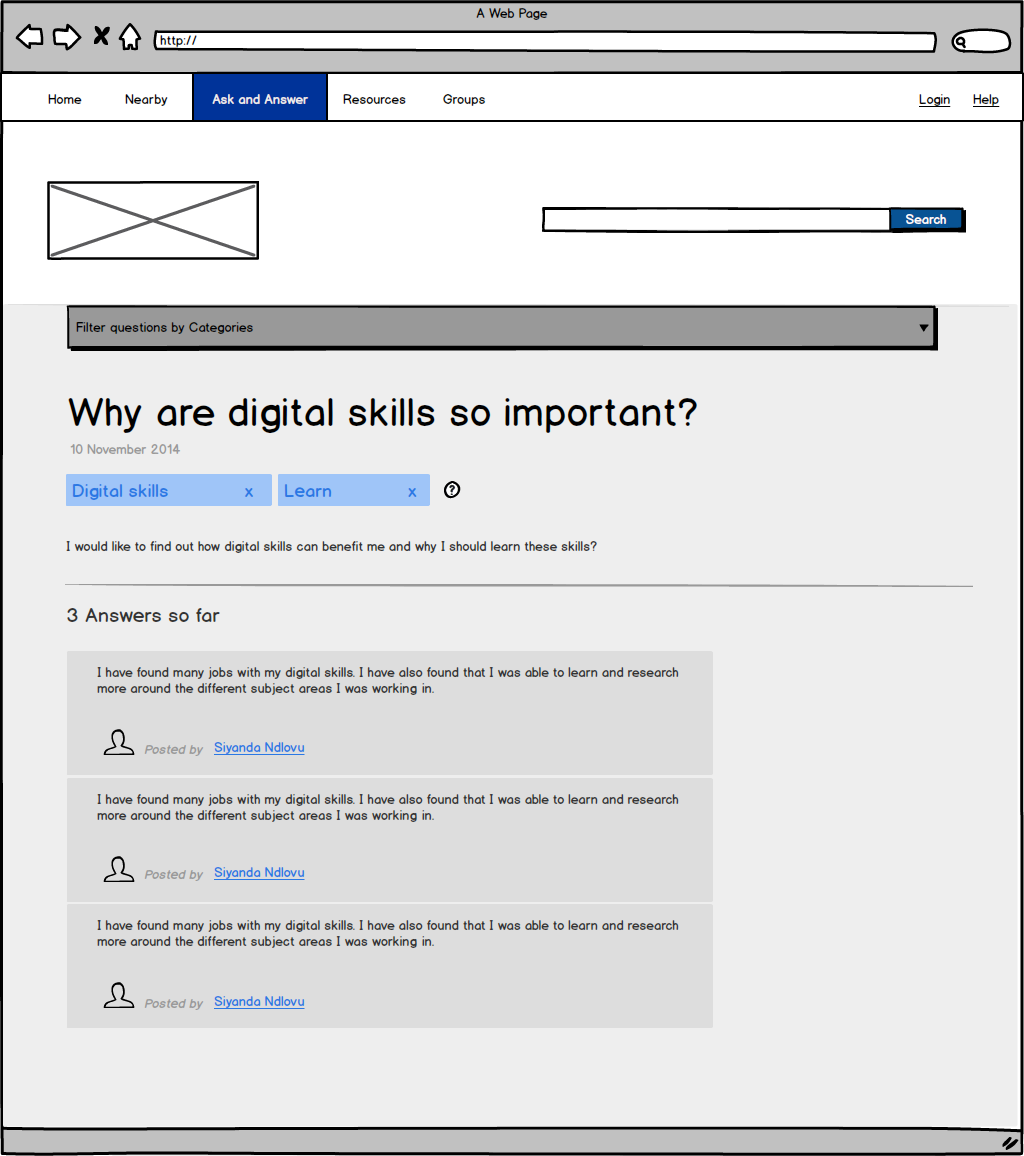
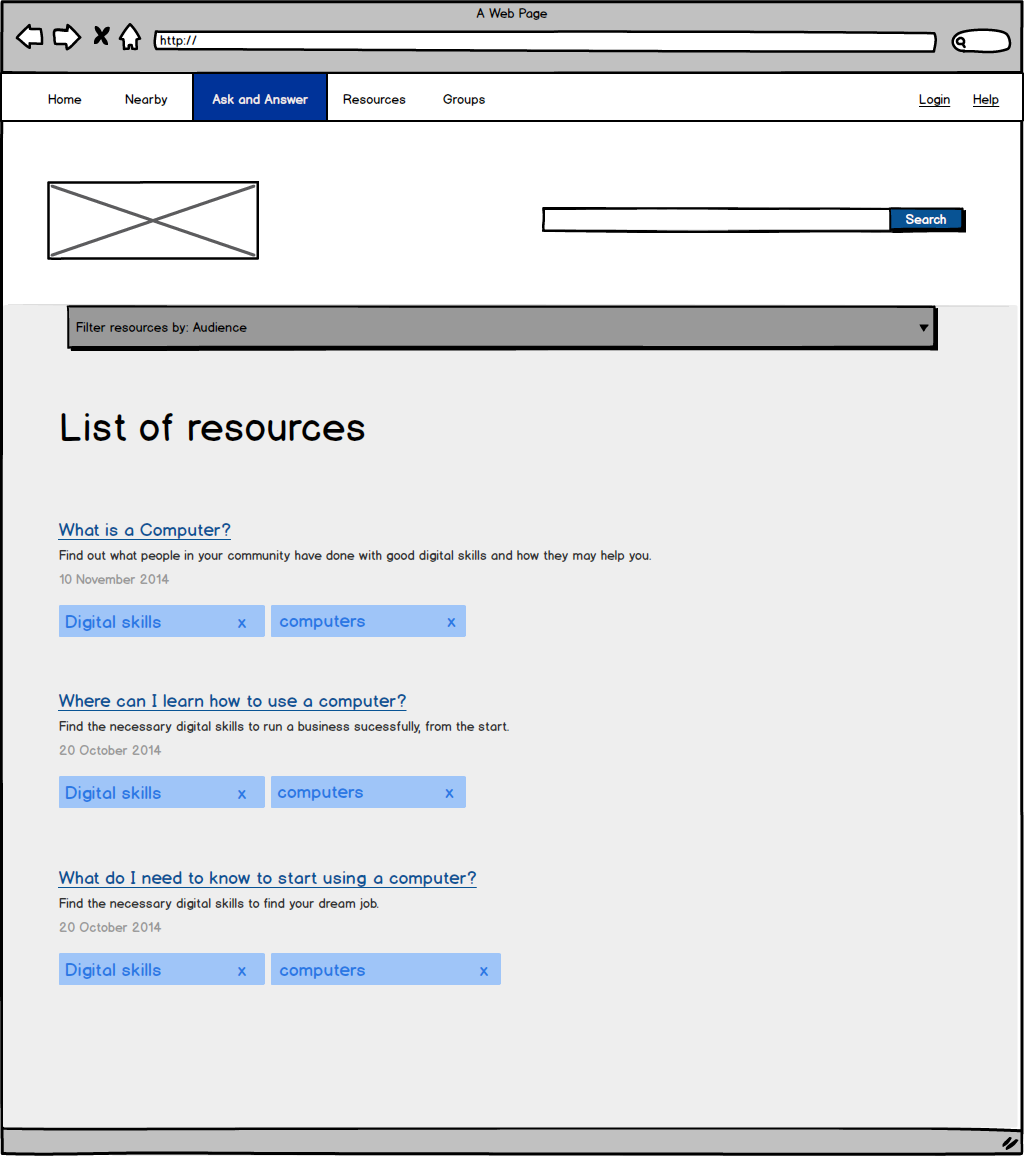
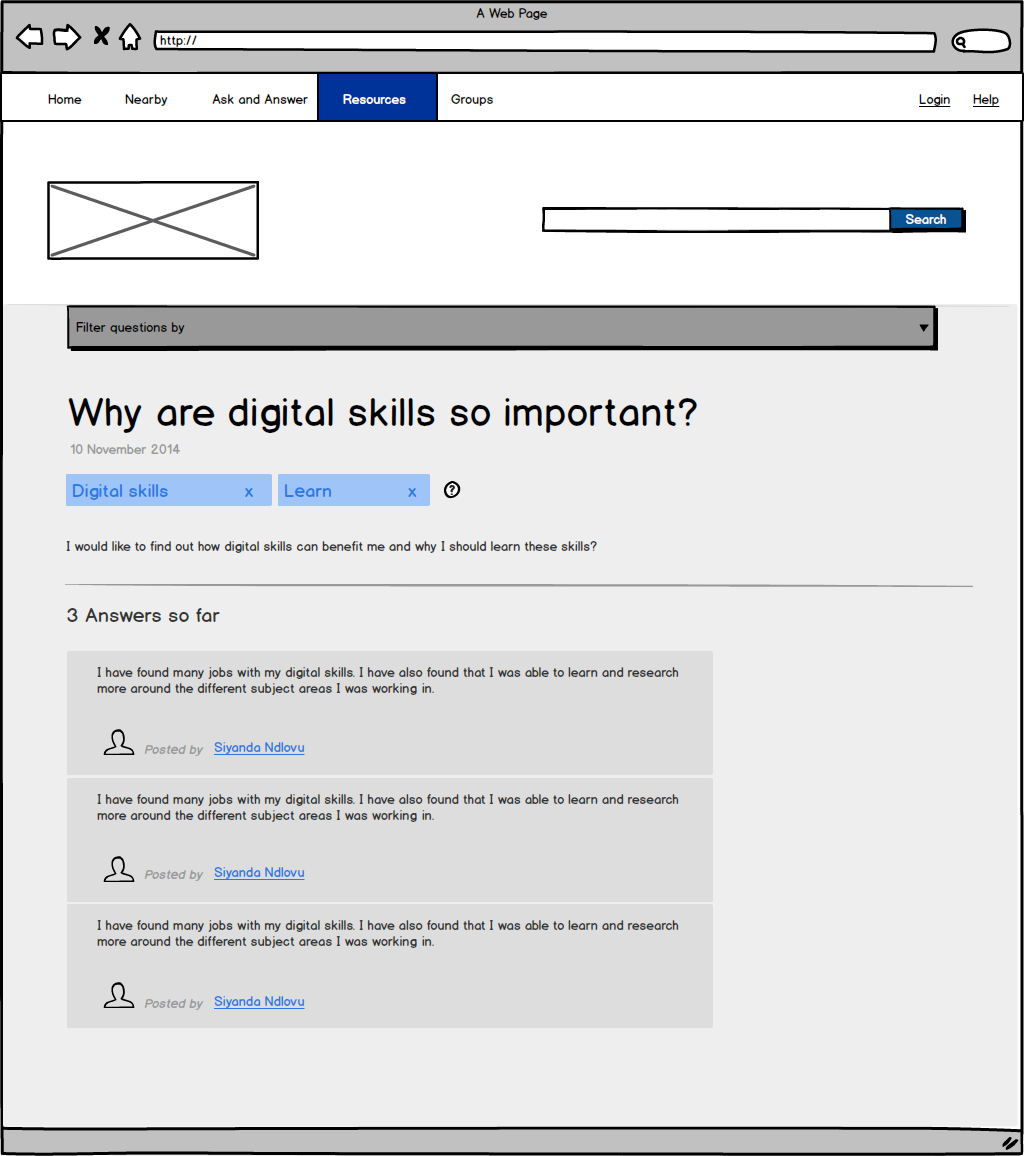
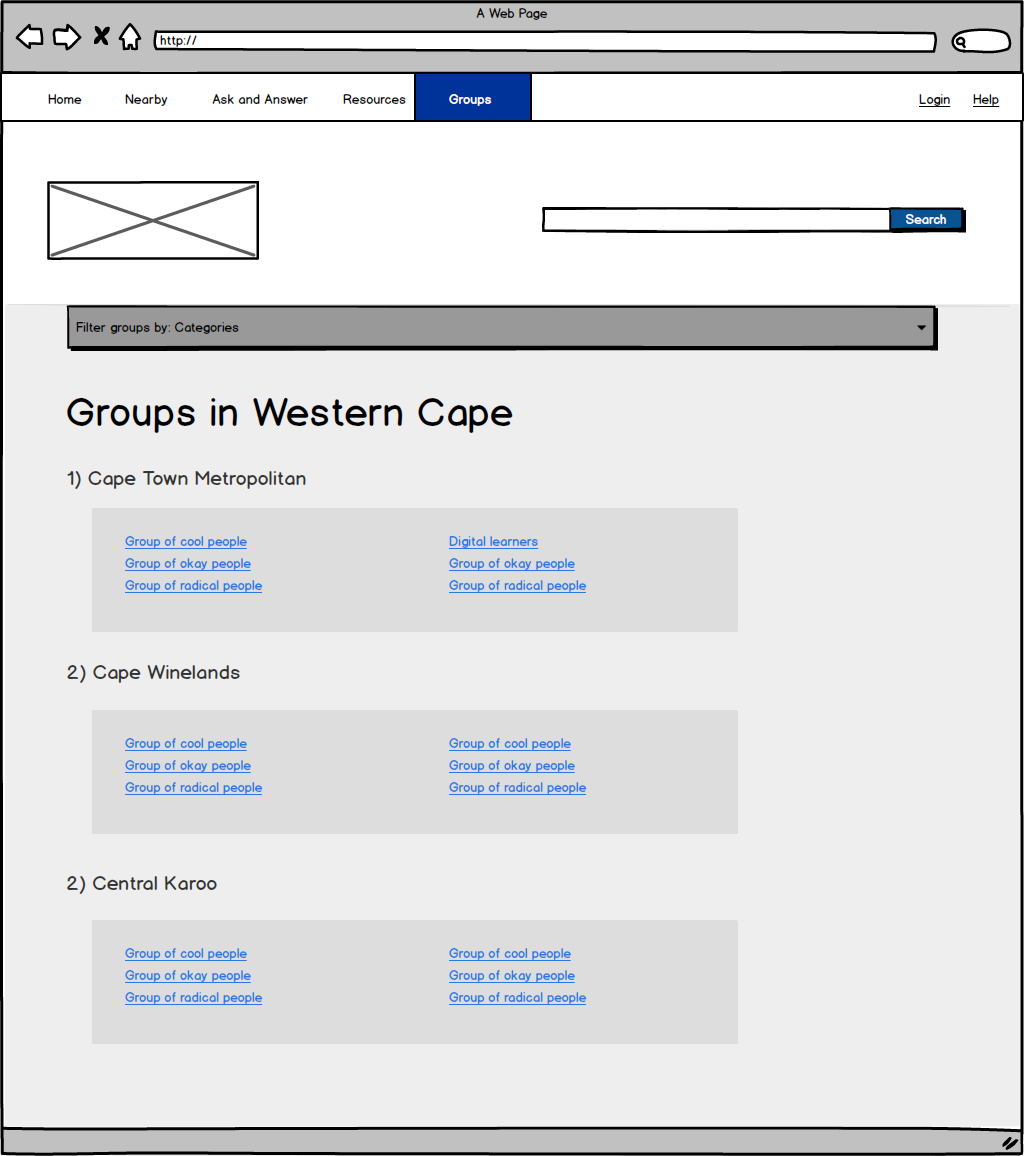
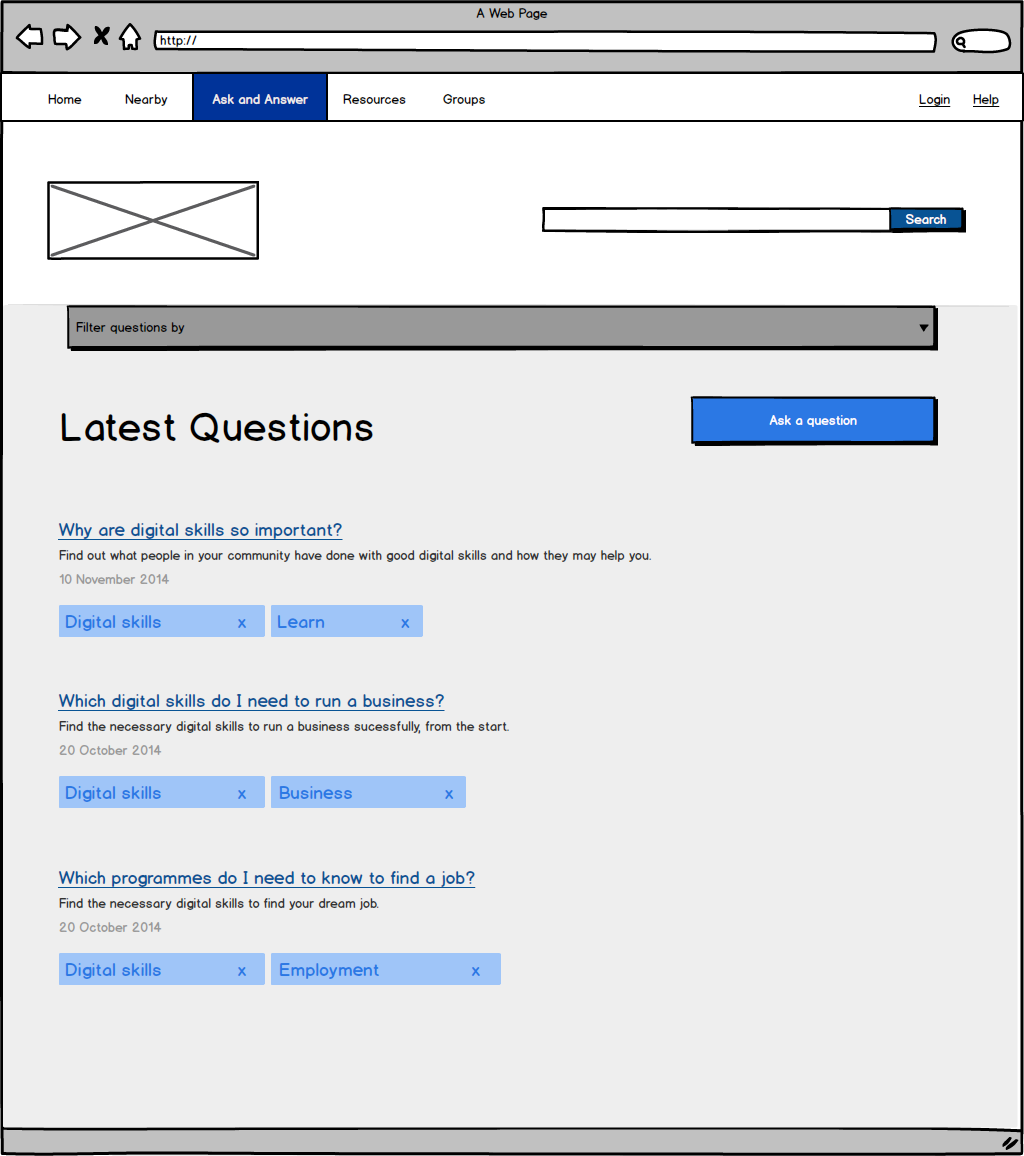
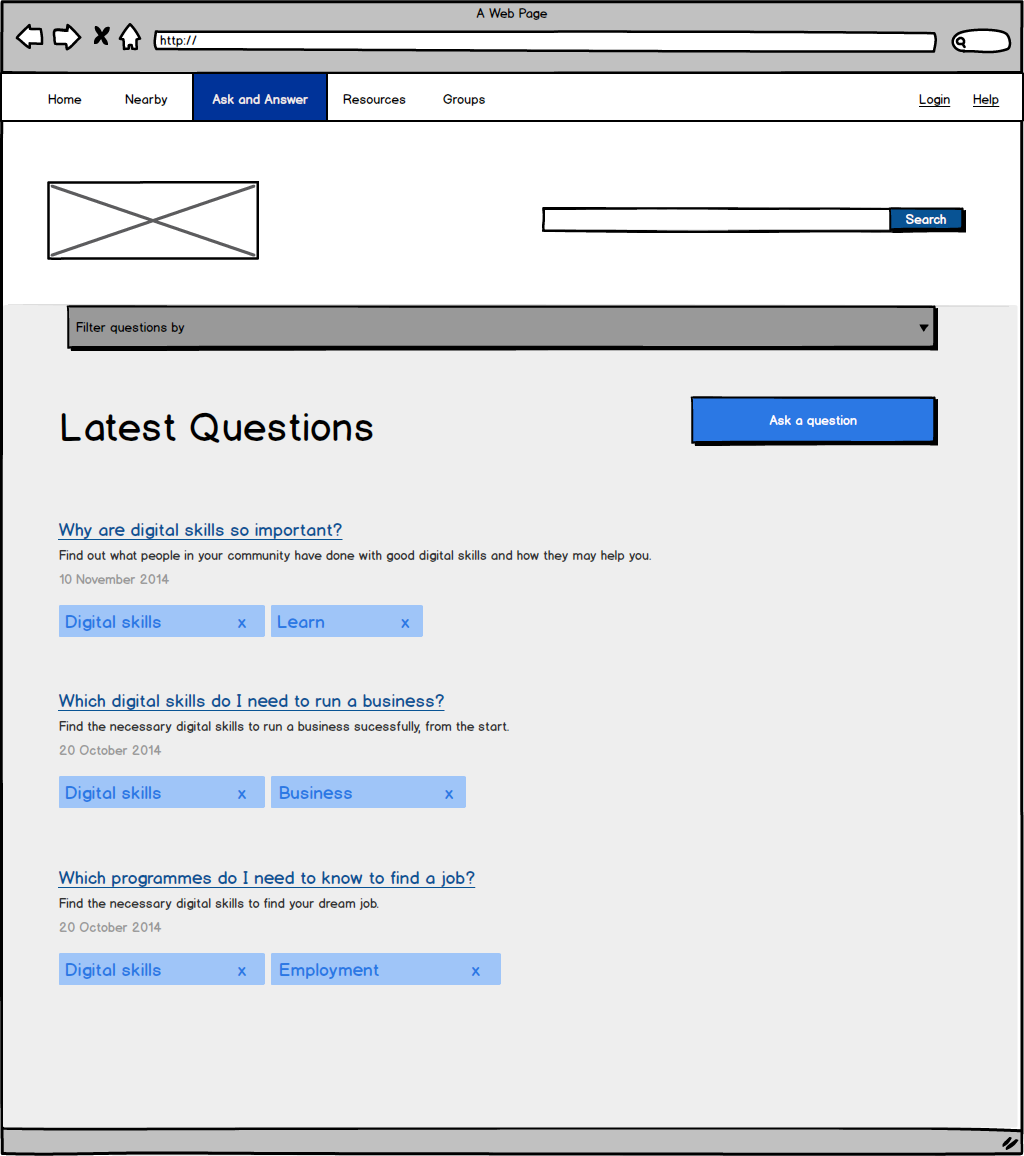
I created low fidelity wireframes in order to capture my thinking throughout the process. These wireframes were created in order to make thinking more tangible and experience what it may look like in context.Here are a few wireframes I created for the Cape Online system, the logo had not been  created yet.
homenearbyask and answerask and answer1ask and answer2ask and answer3

resource1 resoursesgroups

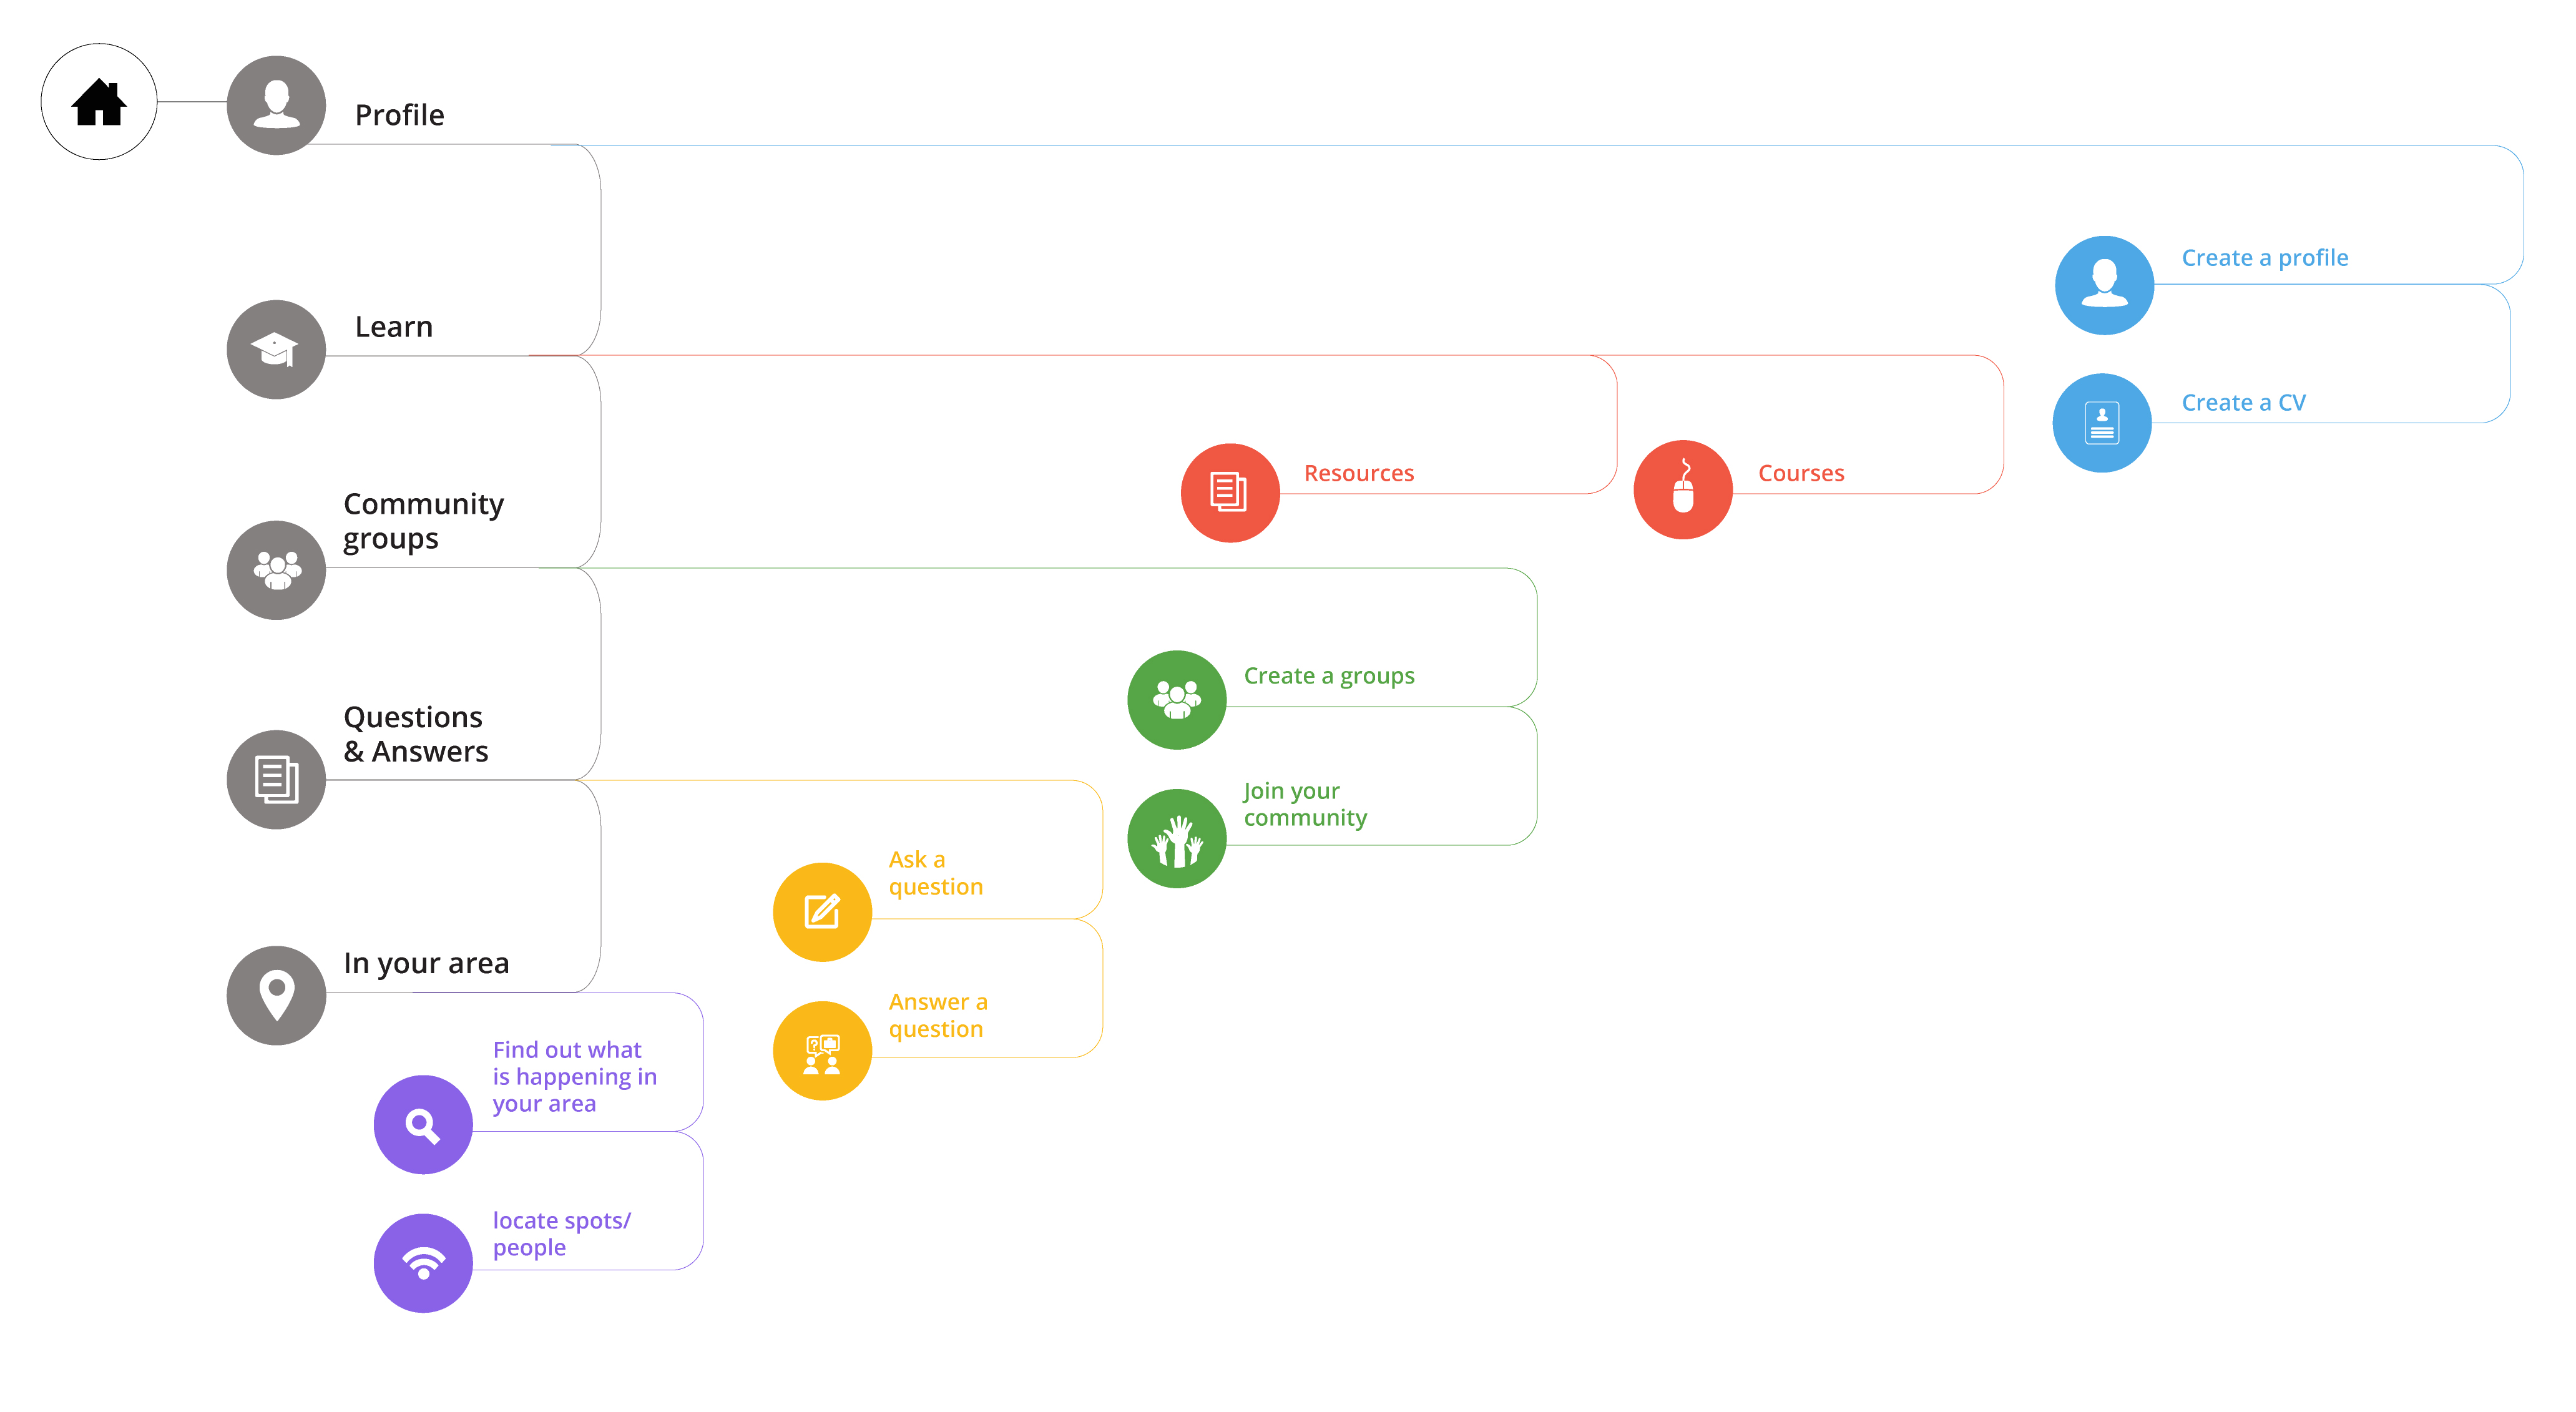
Information Architecture map


“The practice of information architecture is the effort of organizing and relating information in a way that simplifies how people navigate and use information on the Web.”—DSIA Research Initiative


After creating the journey maps, I noticed that there were categories that started form as possible navigational elements. Most importantly, the pathways that users were probably going to travel along, became more visible. I began to mark the main areas of interest and what might fit within that area. This information architecture map below shows the main categories in grey and where each category will lead to is in a colour show what is may be found within that category.
information-architecture

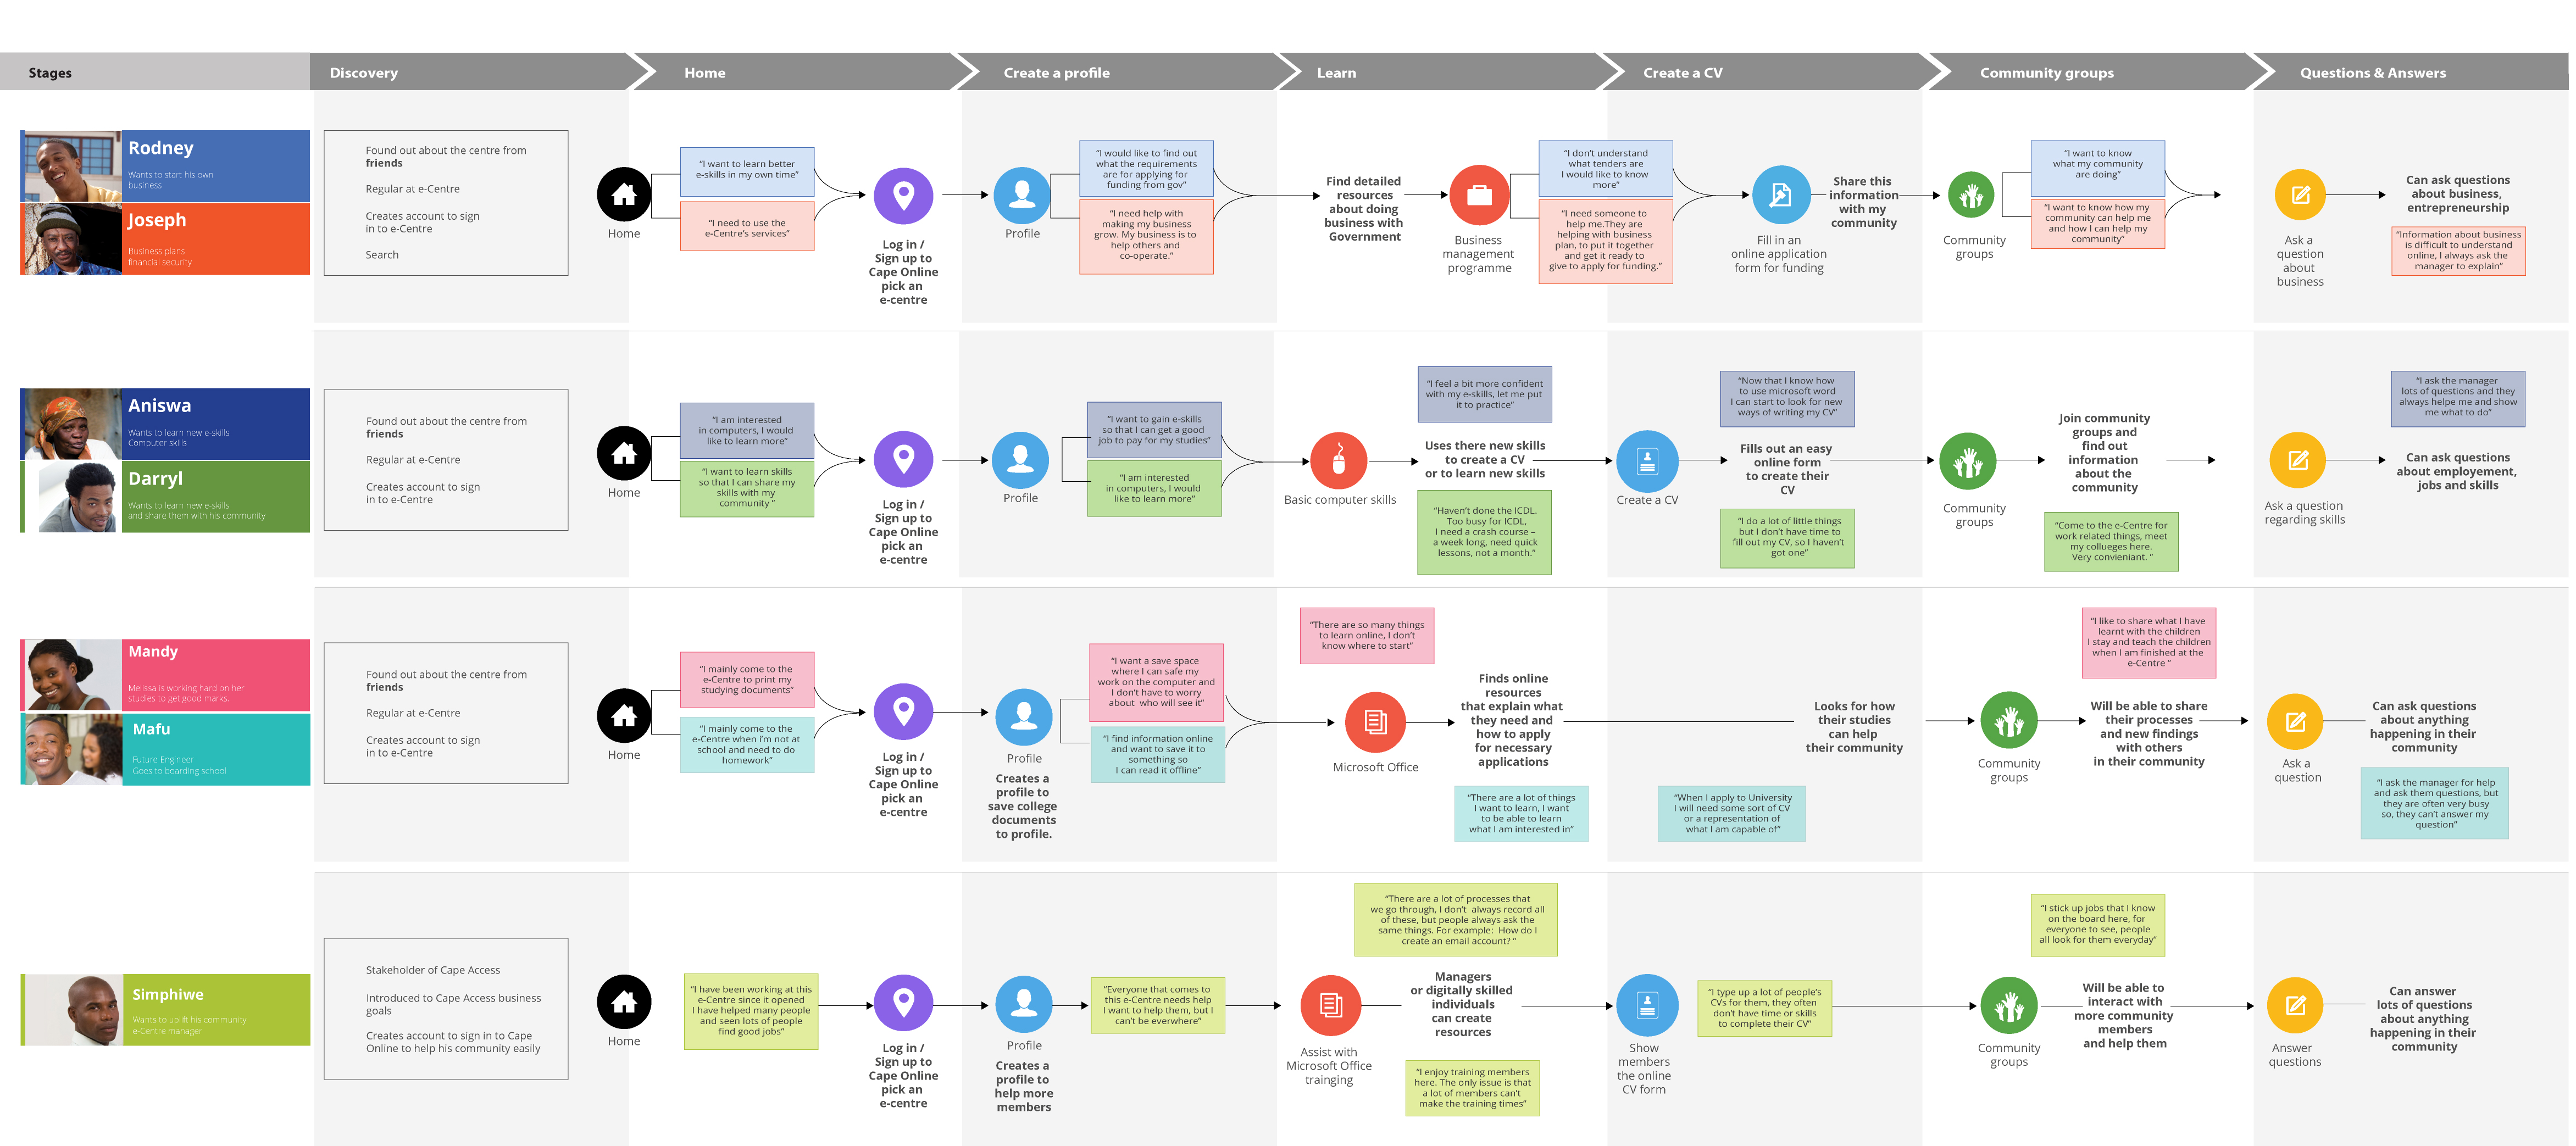
Experience mapping

Once the personas were created I went through the process of mapping out  their pathways according to their goals, needs and motivations. I started to add in some of the quotes from the research findings for more direction through the journeys.

Experience maps are also known as user journey maps, customer journey maps or customer experience maps.
User-journey-map

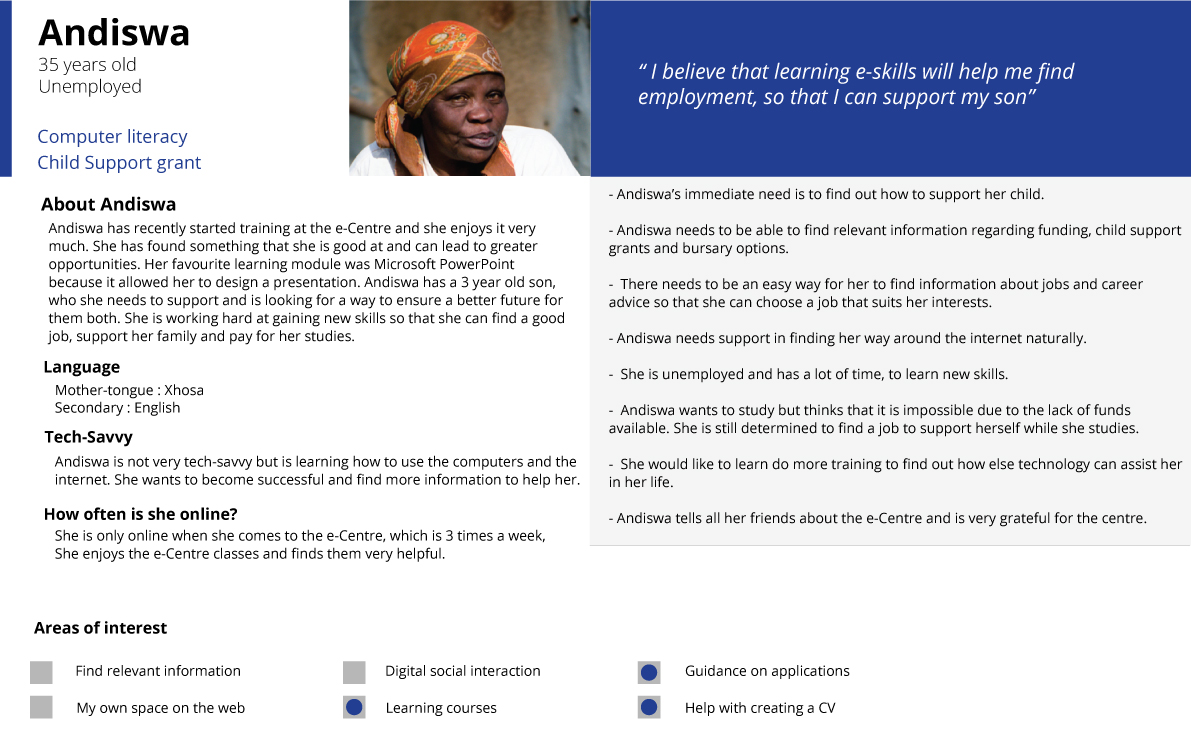
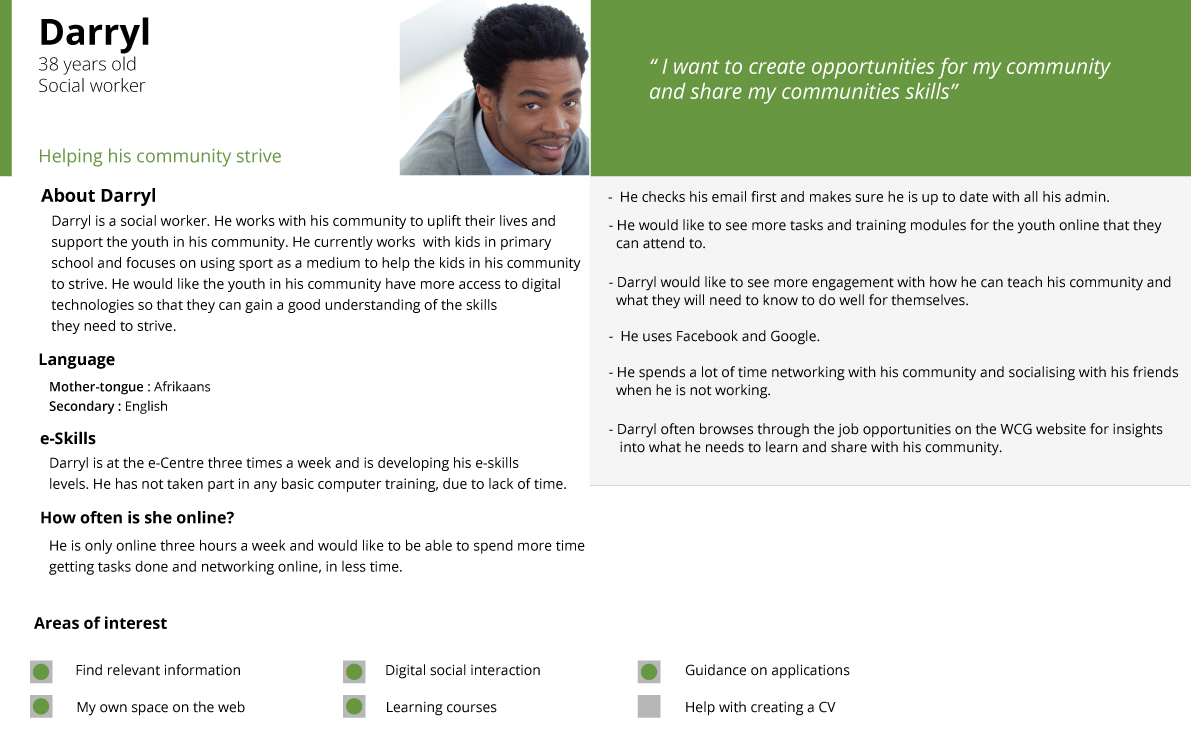
Personas


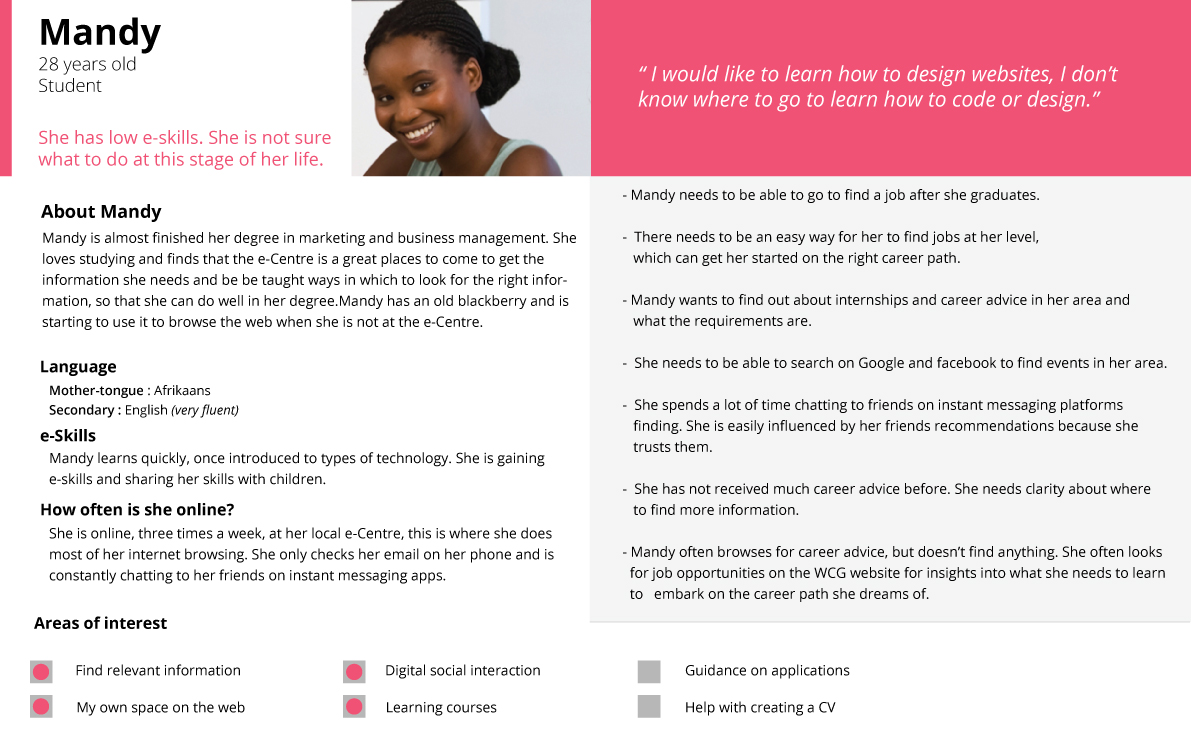
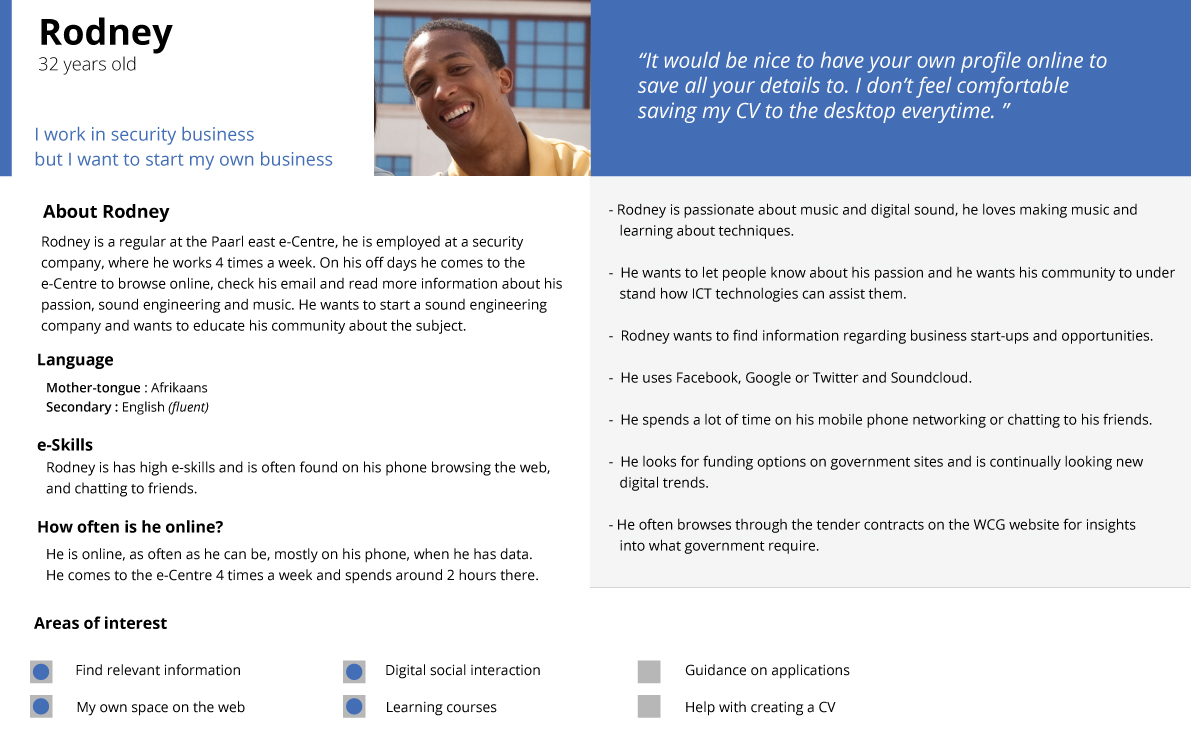
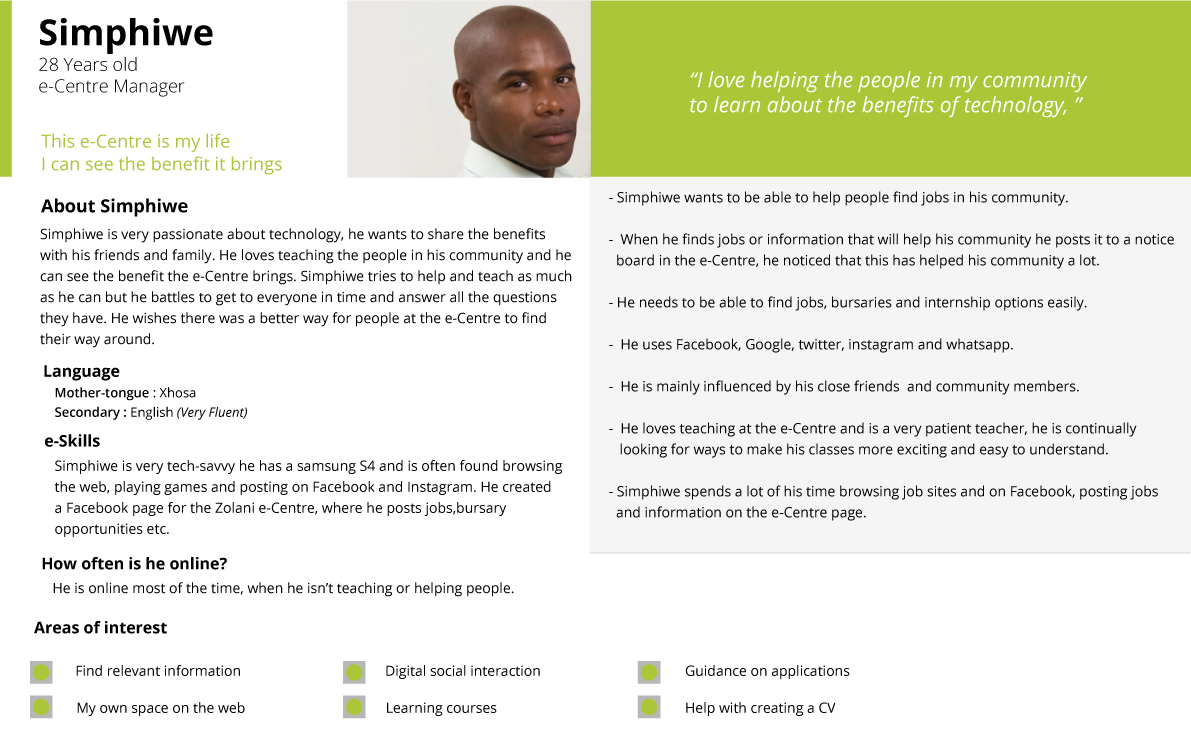
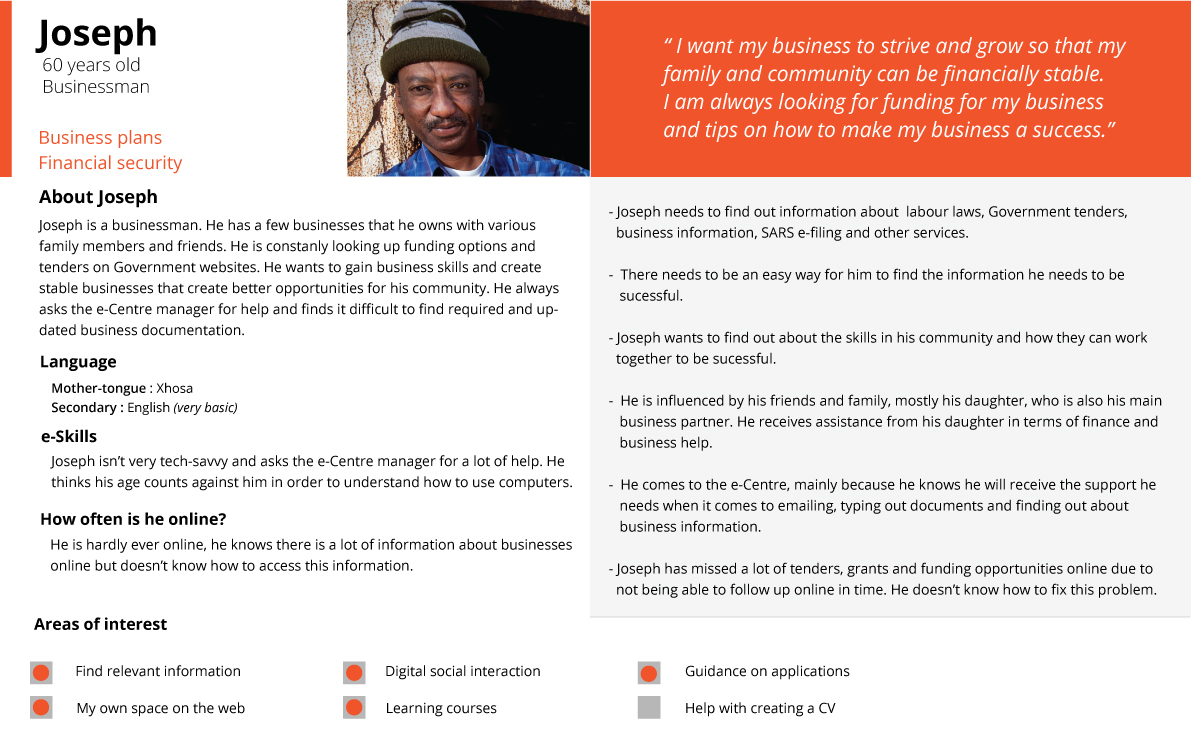
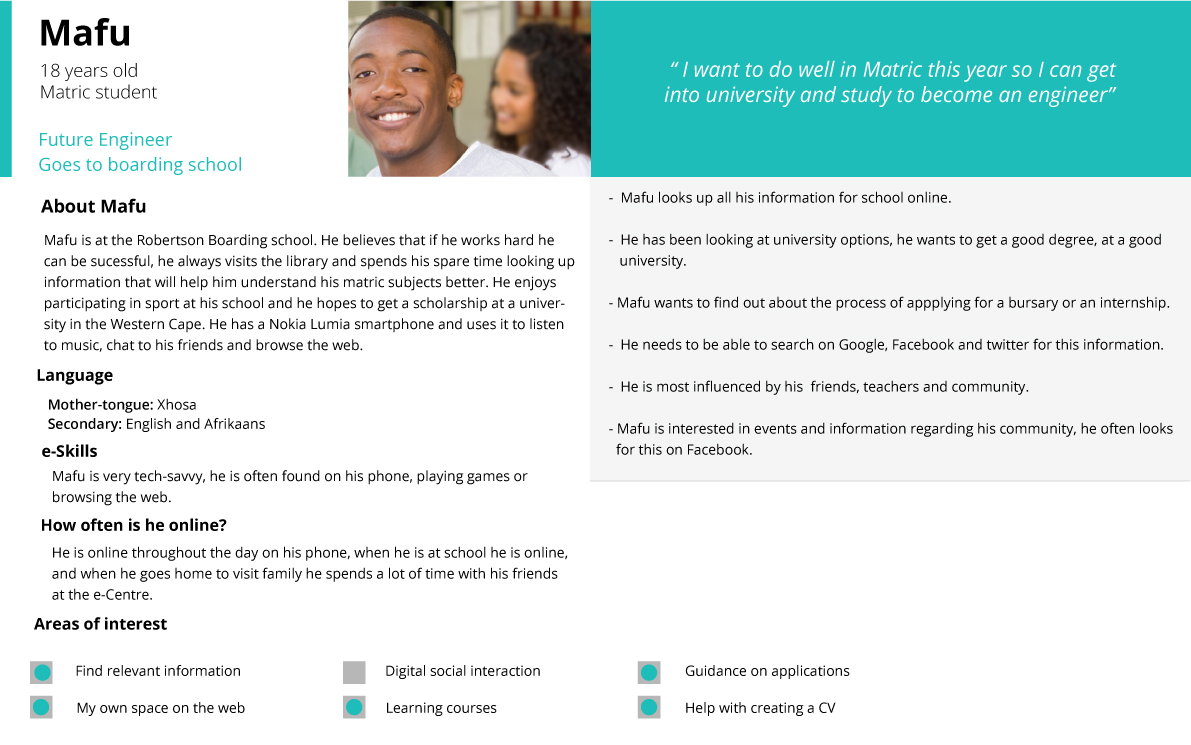
After my research at Paarl-East and Zolani, I developed these seven personas which are based on the participants I spoke to during my research. In total, I interviewed 40 participants from both areas. I then collected the data and sorted it according to similar goals, needs and demographics, it resulted in these 7 personas.

 
Andiswa Darryl Joseph mafu Mandy Rodney Simpiwe

User centered design approach


Design is closely coupled to, and driven by, early systems analysis activities such as needs, task, and functional analyses. Good interaction design involves early and continual involvement of representative users and is guided by well-established design guidelines and principles built on the concept of user-centered design (Norman & Stephen, 1986).

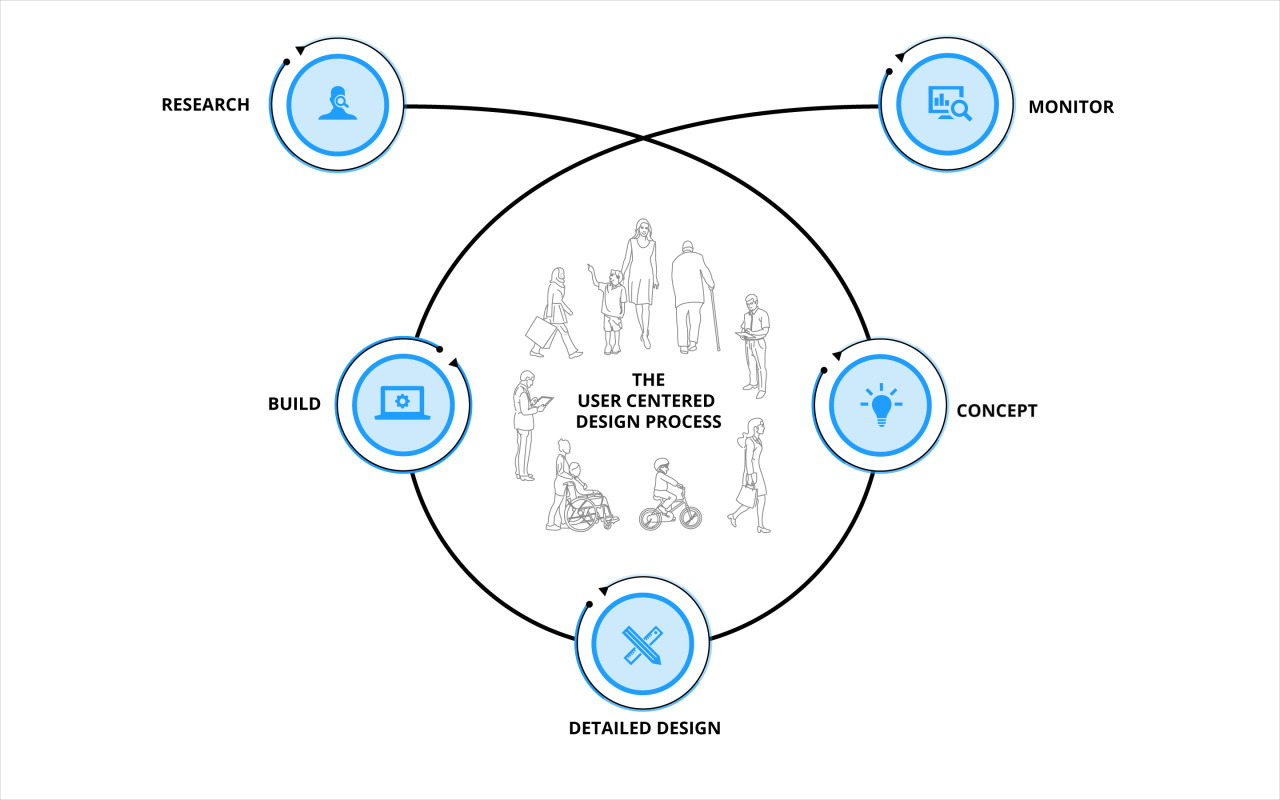
I took on a user-centered design approach by utilising the personas  as they represented real users throughout the process of design. These steps below begin at the research phase on the left, research is done and data is collected and concepts begin to arise in the process of doing so. Concepts begin to become clearer and start extending into what the solution starts to look like. Once the solutions become more distinct the designer begins to create detailed designs. These detailed designs begin to form ideas of how the experience will work and what it will be like in context. This leads to the build stage where prototypes are created and shared with the builders of the system. This leads to the first iteration of the system, which is continually monitored with real users who are providing feedback which the builders and designers then act on to fix and adjust it.

UCD-graphic