Alignment diagram

After all the artefacts were created, I revisited the alignment model that was created at the beginning of this research endeavour.The alignment model was created to illustrate how business and citizen value must align in order to create a value-creating system for the humans involved. The second diagram describes how this model has been applied in this research by explainging how the different layers contribute to different areas of the service provided.

alignment-model alignment-diagram

Prototype

This is the first iteration of the interactive prototype that was created.

Cape Online prototype.

This was the final version that was tested with potential real end users of this system. It is a prototype, so it is not perfect. The main focus of this interactive was to test the CV section of the prototype. How can we create an easy way for users to create a CV that works for them and is easy to use and navigate through?

I conducted tests with the users who I based the persona archetypes on, I tested the interface with a user from each persona type.

IMG_1563


IMG_1575

This prototype was created in UXPin, therefore it might load a bit slower than a normal website.

This is what the create a CV page looks like

This is what the final CV page looks like.

You can navigate the top menu items and look through the rest of the site too.


Detailed designs


Below are some detailed designs that I designed. At this stage I was exploring the possible design elements, such as how to assemble the visual language elements into relationships that work well together, there are different designs that showcase this below.


05-CapeOnline-profile-cv-form


03-CapeOnline-profile-coursesCapeOnline-QA-categories


CO_your-area CO_your-area02 CO_your-area03


01-CapeOnline-profile-activity

CapeOnline-Resource CapeOnline-ResourcePage-email

Wireframes

I created low fidelity wireframes in order to capture my thinking throughout the process. These wireframes were created in order to make thinking more tangible and experience what it may look like in context.Here are a few wireframes I created for the Cape Online system, the logo had not been  created yet.
homenearbyask and answerask and answer1ask and answer2ask and answer3

resource1 resoursesgroups

Information Architecture map


“The practice of information architecture is the effort of organizing and relating information in a way that simplifies how people navigate and use information on the Web.”—DSIA Research Initiative


After creating the journey maps, I noticed that there were categories that started form as possible navigational elements. Most importantly, the pathways that users were probably going to travel along, became more visible. I began to mark the main areas of interest and what might fit within that area. This information architecture map below shows the main categories in grey and where each category will lead to is in a colour show what is may be found within that category.
information-architecture

Experience mapping

Once the personas were created I went through the process of mapping out  their pathways according to their goals, needs and motivations. I started to add in some of the quotes from the research findings for more direction through the journeys.

Experience maps are also known as user journey maps, customer journey maps or customer experience maps.
User-journey-map

Personas


After my research at Paarl-East and Zolani, I developed these seven personas which are based on the participants I spoke to during my research. In total, I interviewed 40 participants from both areas. I then collected the data and sorted it according to similar goals, needs and demographics, it resulted in these 7 personas.

 
Andiswa Darryl Joseph mafu Mandy Rodney Simpiwe

User centered design approach


Design is closely coupled to, and driven by, early systems analysis activities such as needs, task, and functional analyses. Good interaction design involves early and continual involvement of representative users and is guided by well-established design guidelines and principles built on the concept of user-centered design (Norman & Stephen, 1986).

I took on a user-centered design approach by utilising the personas  as they represented real users throughout the process of design. These steps below begin at the research phase on the left, research is done and data is collected and concepts begin to arise in the process of doing so. Concepts begin to become clearer and start extending into what the solution starts to look like. Once the solutions become more distinct the designer begins to create detailed designs. These detailed designs begin to form ideas of how the experience will work and what it will be like in context. This leads to the build stage where prototypes are created and shared with the builders of the system. This leads to the first iteration of the system, which is continually monitored with real users who are providing feedback which the builders and designers then act on to fix and adjust it.

UCD-graphic

Research in Zolani

The next round of research that I went through was in Zolani, which is close to Robertson. I really enjoyed my research here, the people I met were very passionate about the betterment of their community. Similar to the Paarl-East research round, I spent 3 days at the centre, in the same structure; On the first day, I just observed what was happening at the e-Centre, on the second and third day I interviewed some e-Centre members.

Zolani e-Centre opened at 9am and closed at 5pm.

On the first day I managed to sit in on two classes that were being taught. One was on on Microsoft power point and the other was on Microsoft word. The e-Centre manager was the trainer. He was very good at getting the class involved in the activity first before explaining what the interface meant. He let them play around with the programmes first, so they knew what they were dealing with. Once they had played around for at least 45 minutes, he asked them  to ask him questions regarding what they had observed in the interface. Then he would start the class, I thought that was a really nice way to keep the class naturally curious about what they were dealing with.

observe-zolani

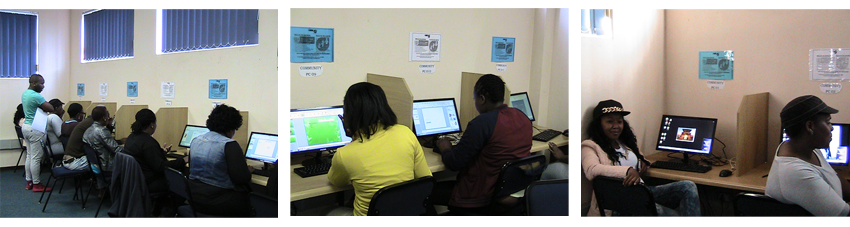
On the first day, I had felt very excited, a lot of people came to chat to me in person and ask me what I was doing here, they were all very interested and loved sharing their stories, which I enjoyed. I engaged in a lot of natural conversation at Zolani, a lot more than at Paarl-East.

On the second day, I interviewed members in a room just outside of the e-Centre. I had told some of the members I met on day one that I was going to be running casual interviews and I they were welcome to come talk to me. A lot of them showed up for interviews. The community was very small, most people knew each other and had grew up together. It was for this reason that I had offered participants the option to be interviewed in pairs. It is believed that interviewing close friends or couples provide more information and feel more comfortable with talking freely.

blog-zolani4

blog-zolani3

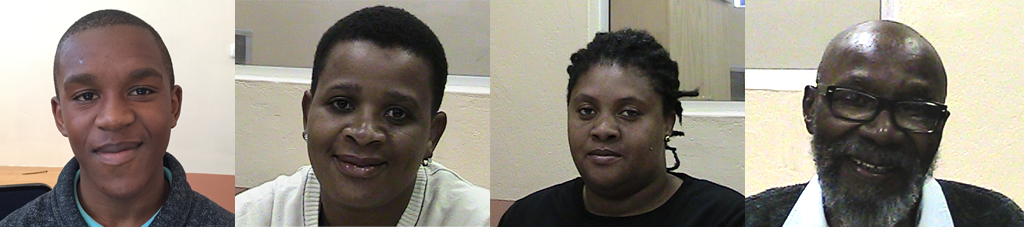
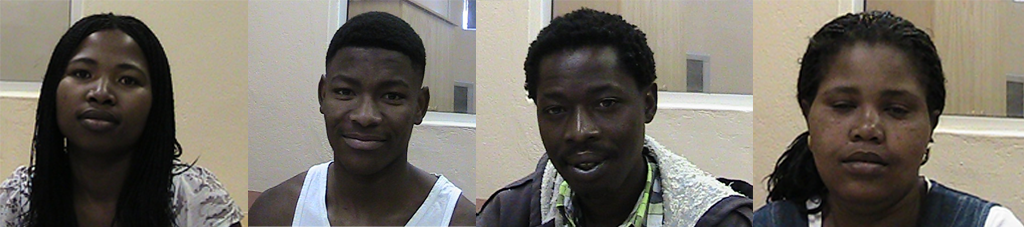
I managed to interview 2 pairs of unemployed females, and 4 individual interviews (2 matric students, 1 business man and one senior citizen)

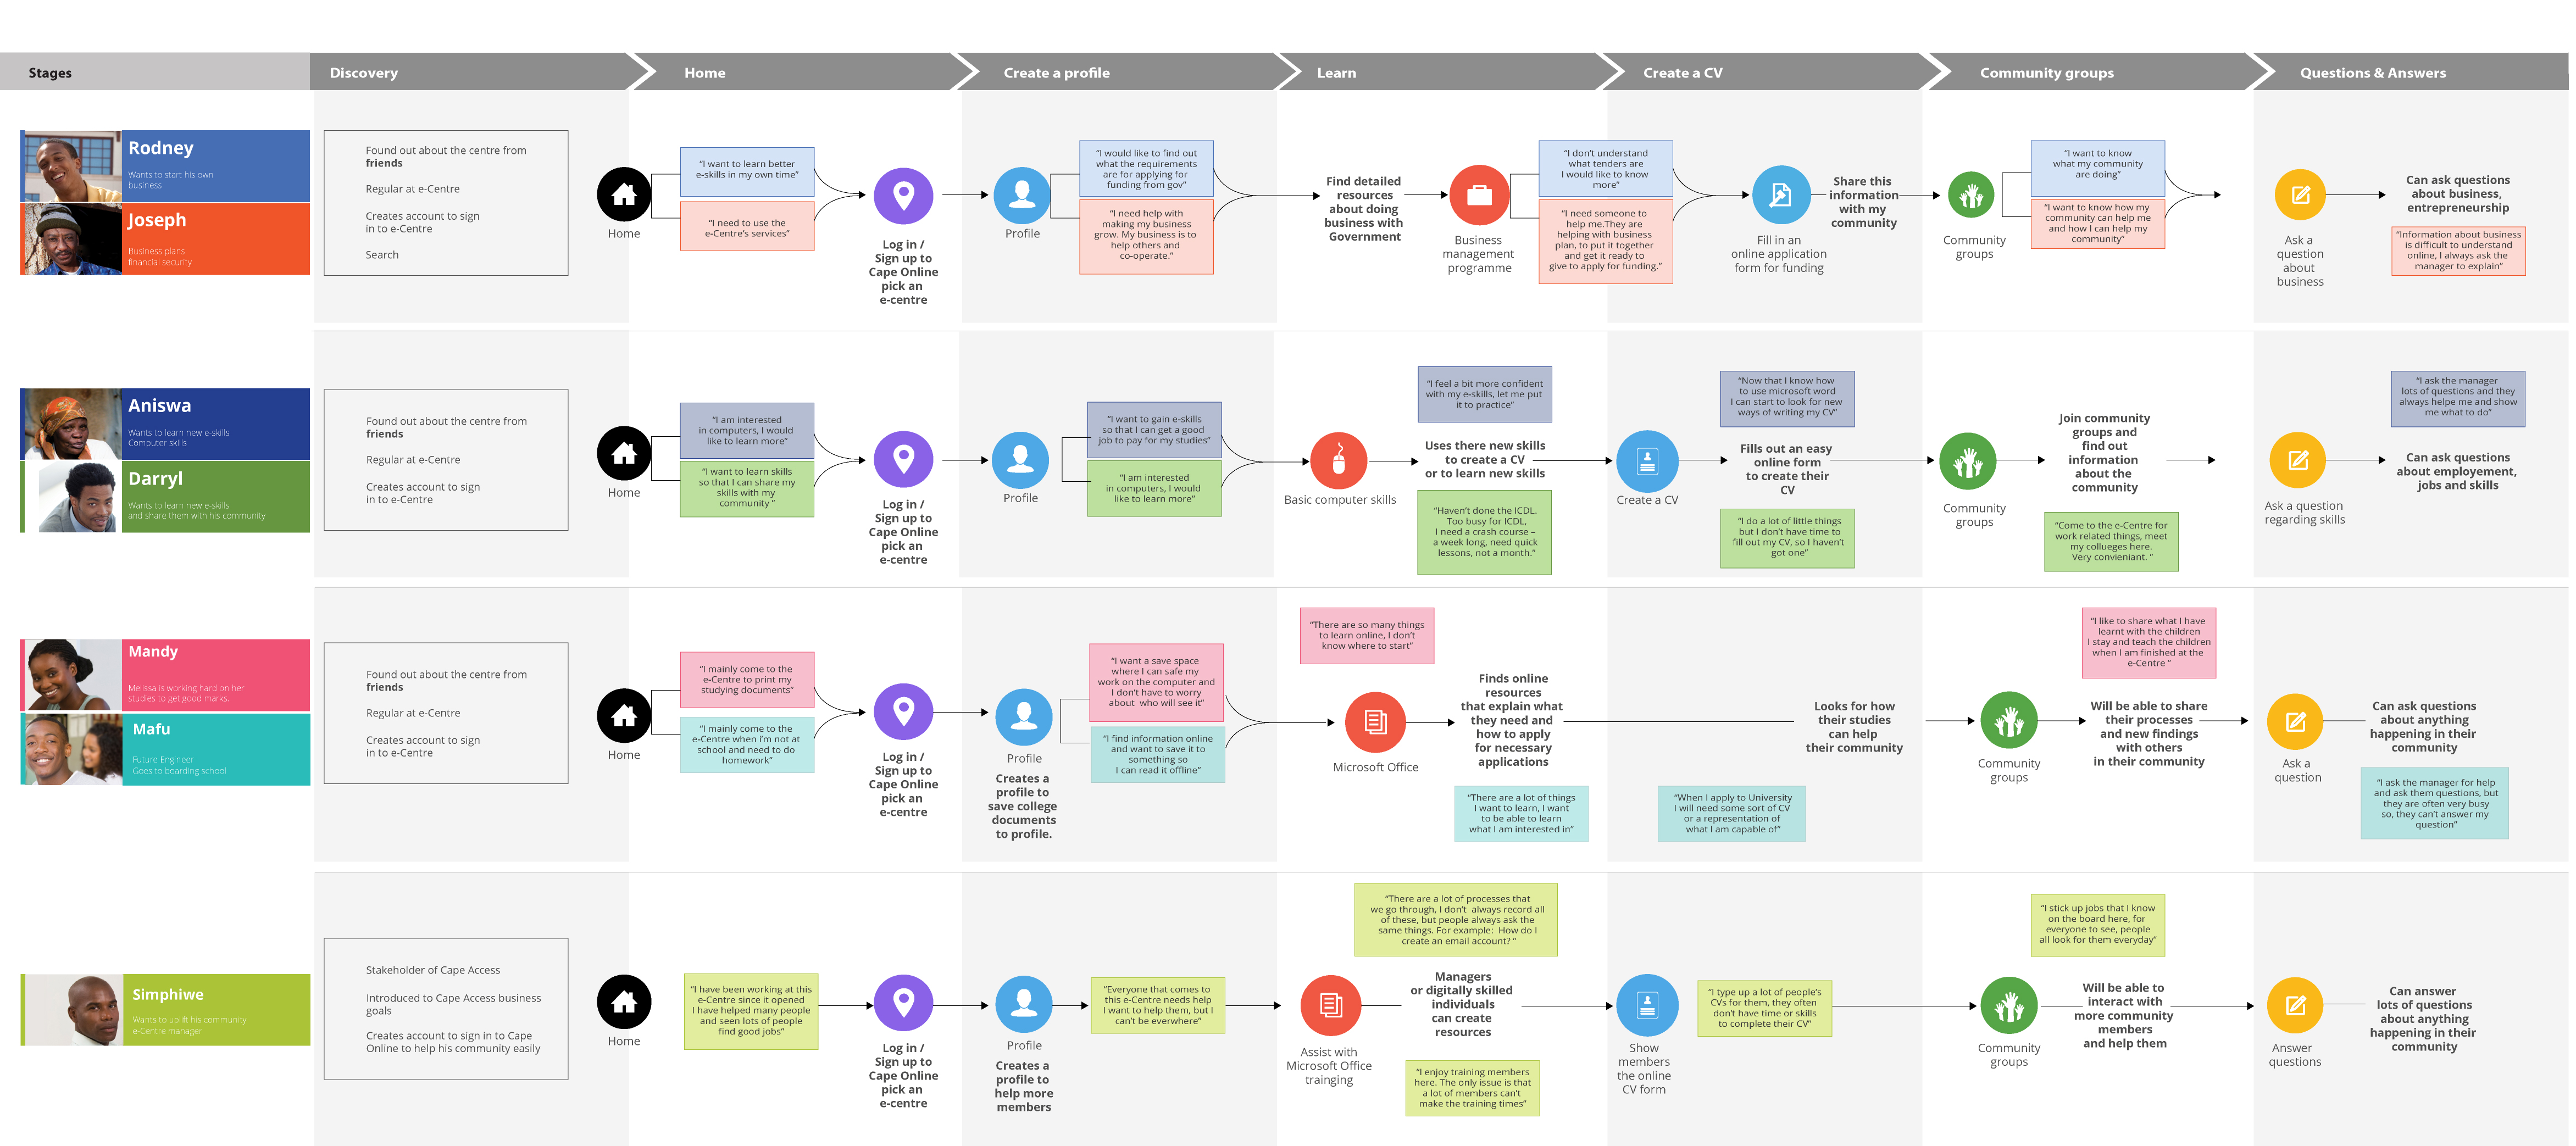
This is what was found from a very high-level perspective:

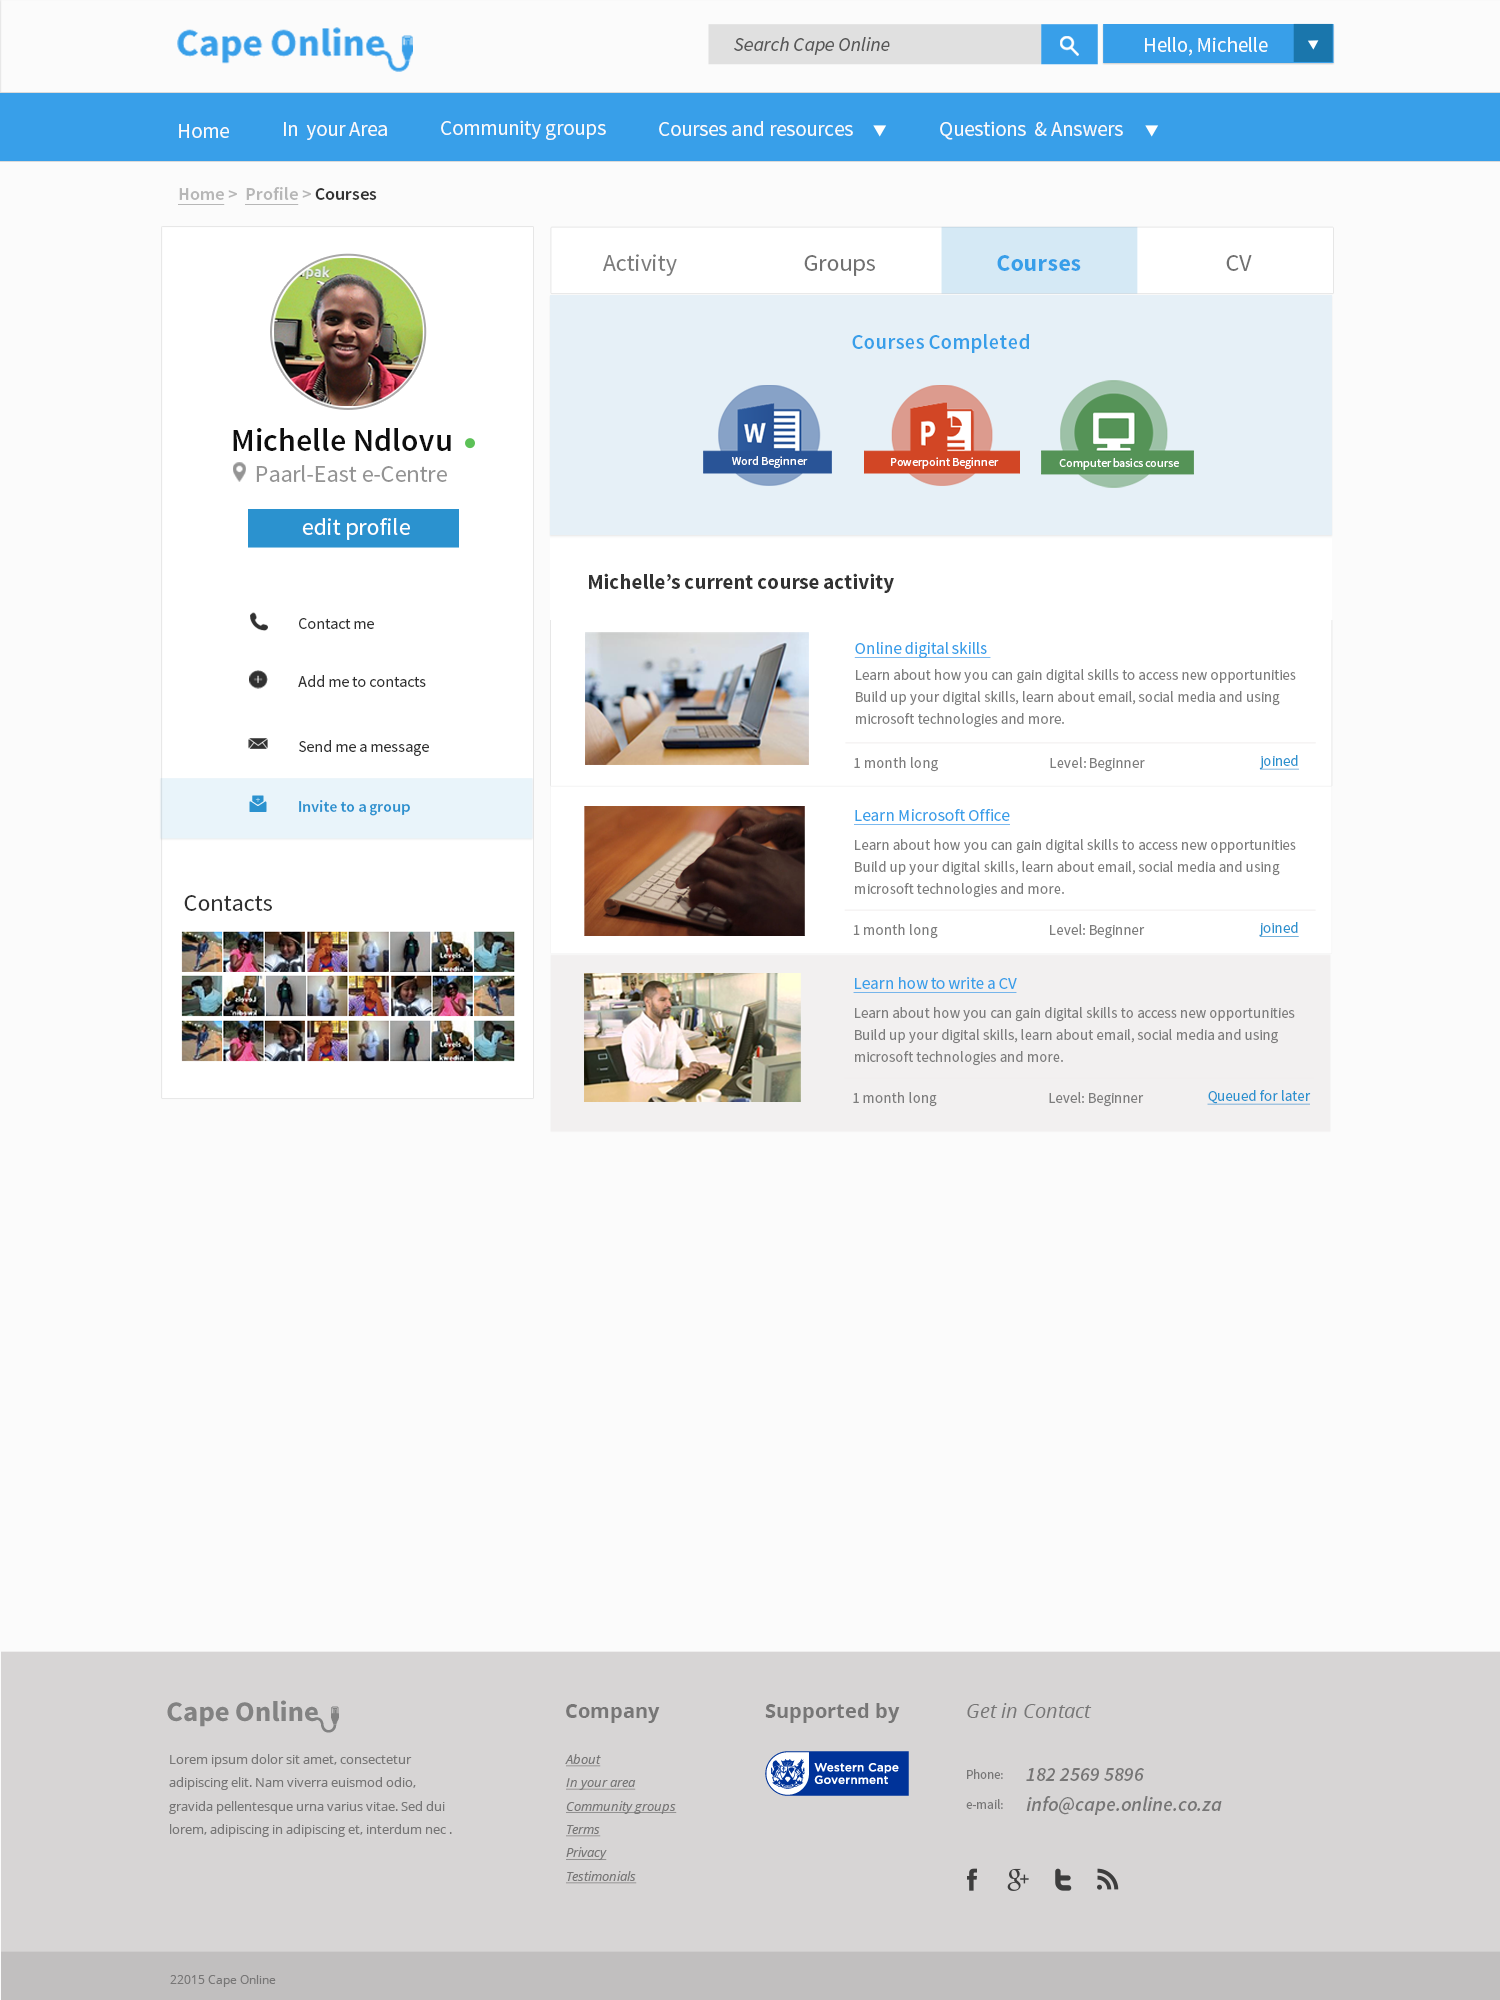
1. Most people interviewed were unemployed and came to the centre to get help with creating their CV.
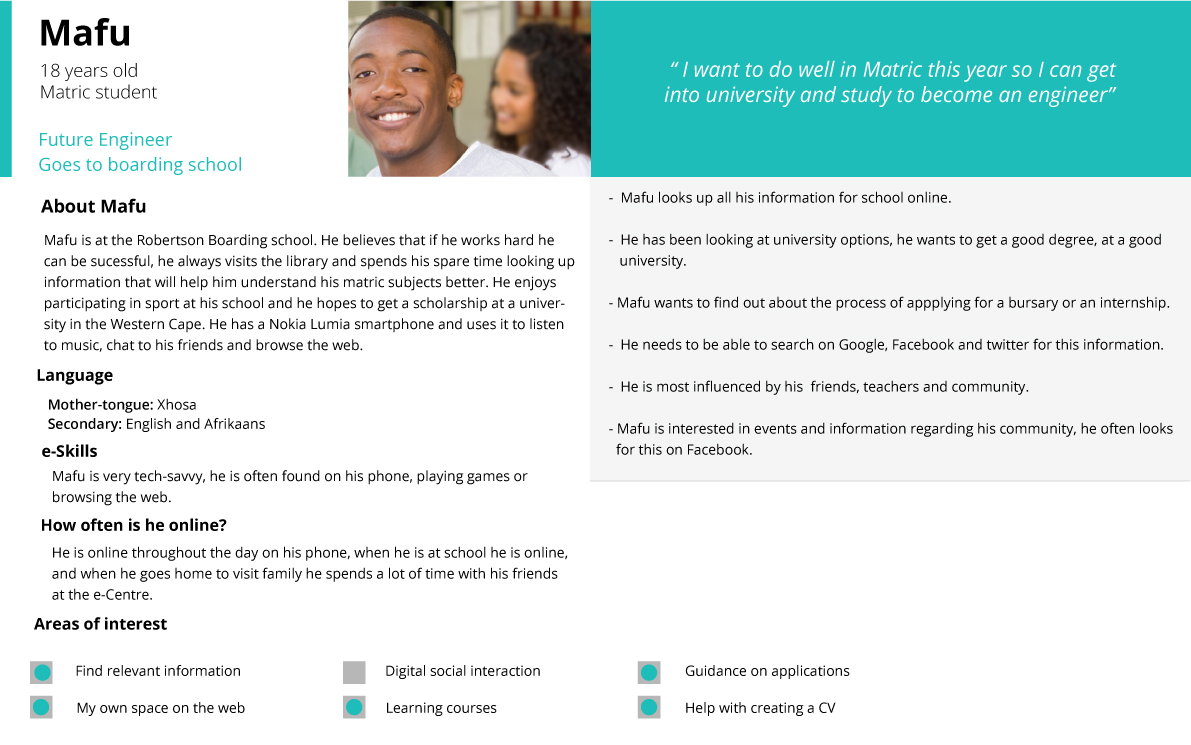
2. The matric students were both part of a study group, which most of the matric students came to at the e-Centre/library.
3. The unemployed members had all come to the e-Centre to attend their basic computer training course.
4. The senior citizen had reported that he came to the e-Centre to get some documentation done, he said he normally asks the manager to help him, since he can’t use a computer. The manager types up his information and sends it from a centre email.
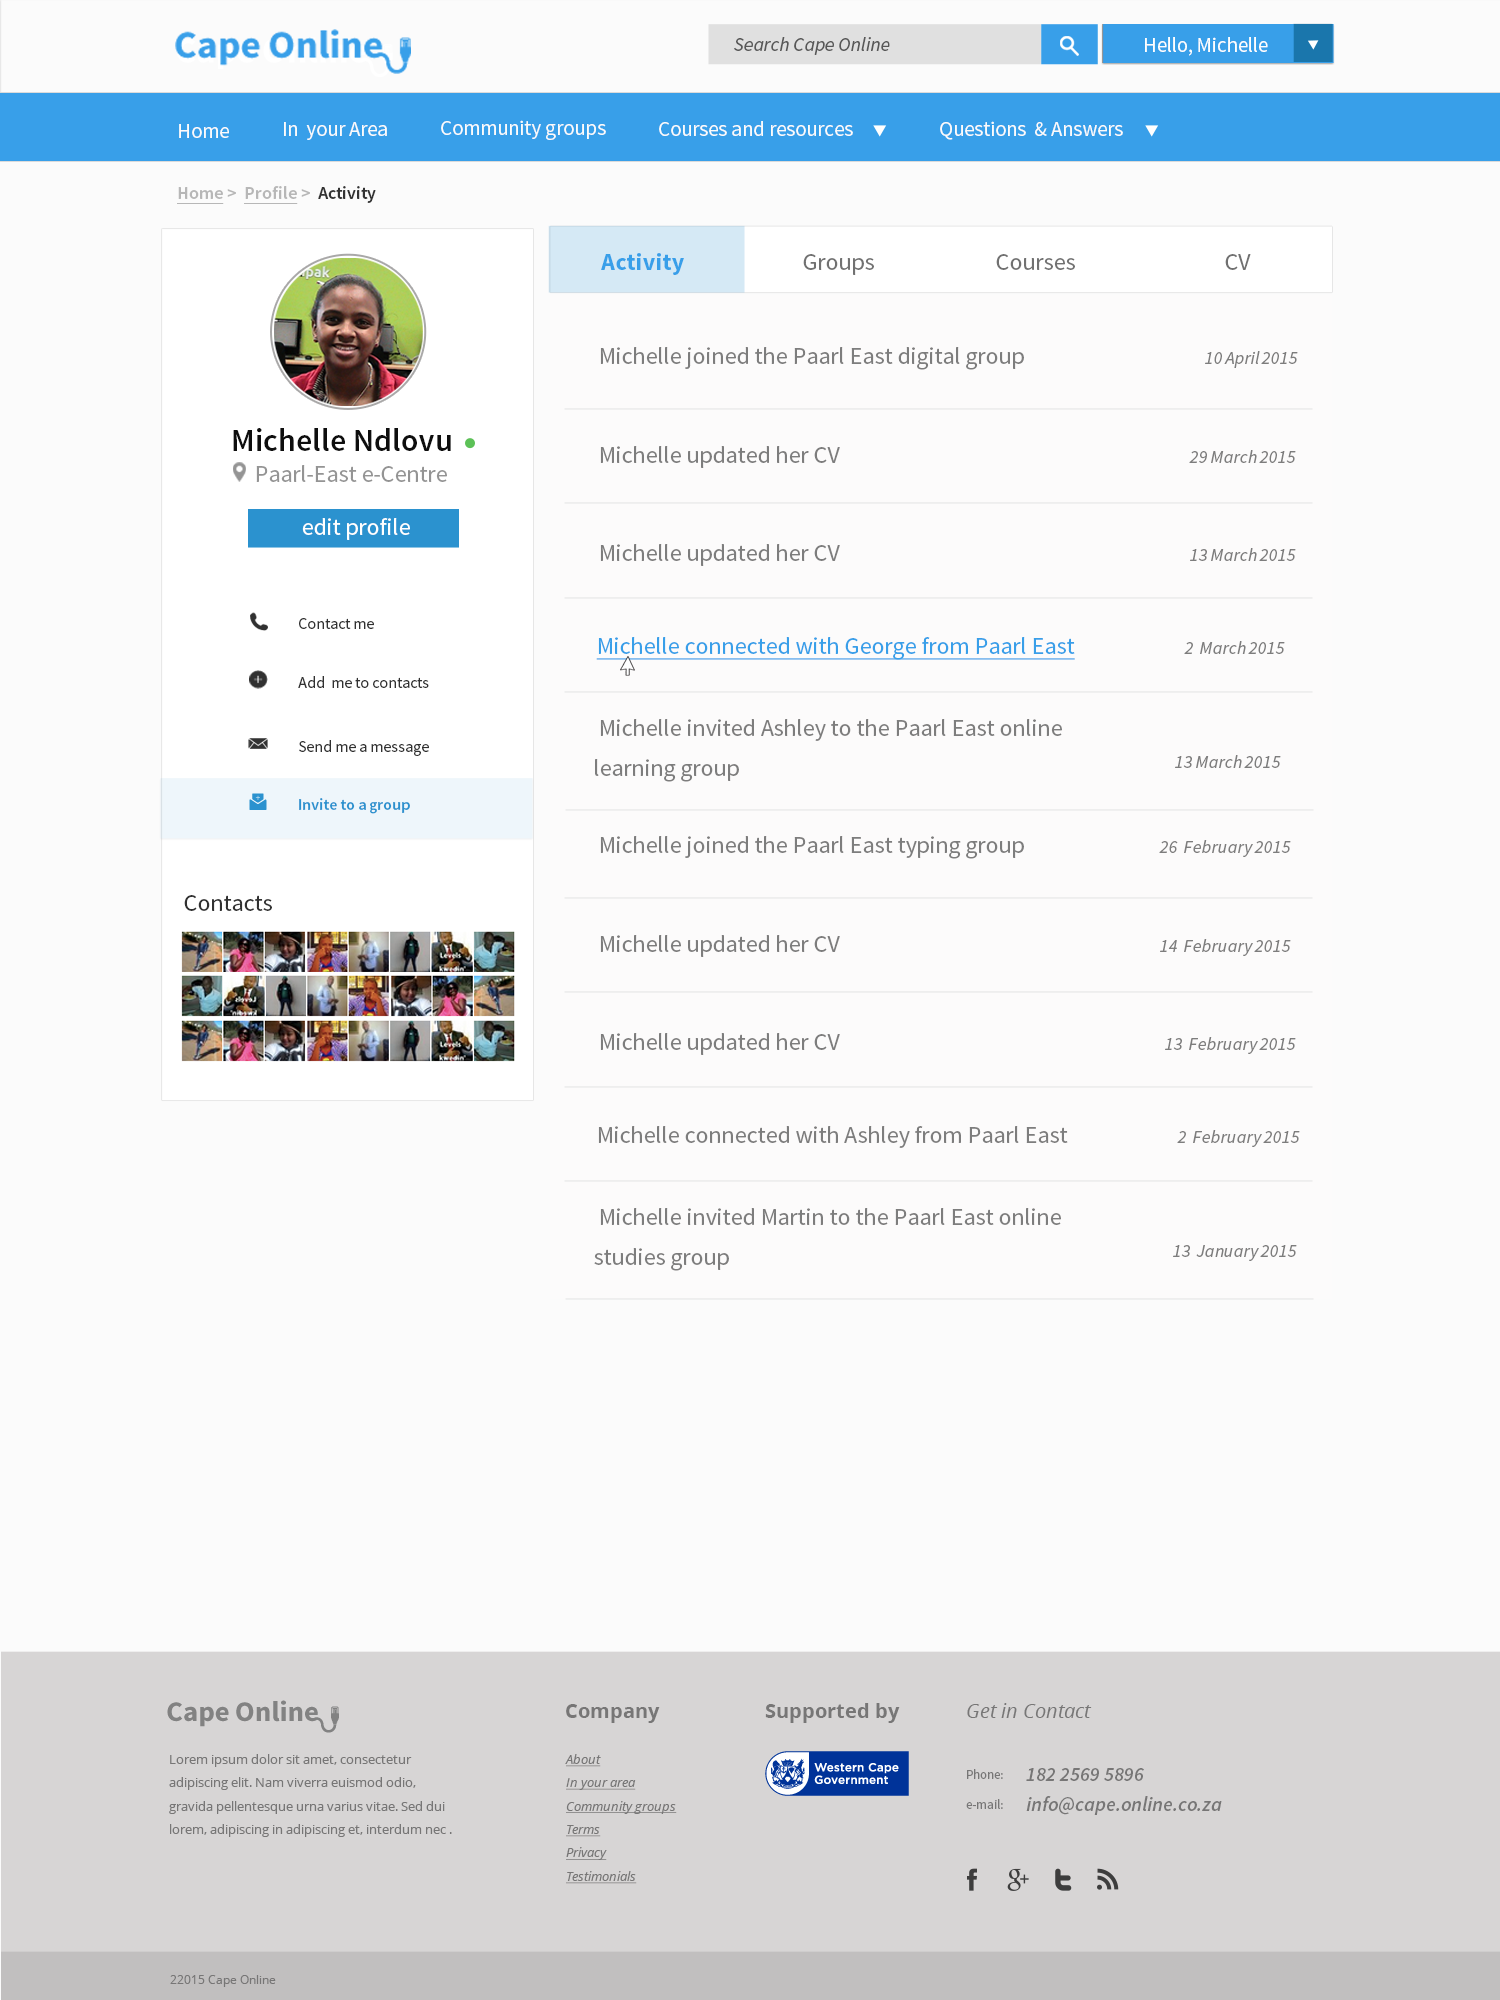
5. 1 member had reported that she recently got a job, which she managed to get through the help and assistance of the technology provided, she still comes to the centre on said that she is not working, check her Facebook and email.
6. Most participants had very medium to very low digital skills. The matric students had decent digital skills, but had reported that their schools did not have computers, which is why they spend so much time here learning how to use the provided technology.
7. All participants stayed very close to the e-Centre and were visited the e-Centre on daily basis.
8. Participants reported that they often asked for help and sometimes the manager would be busy with someone else, so they often didn’t get help before the computer session had timed out.
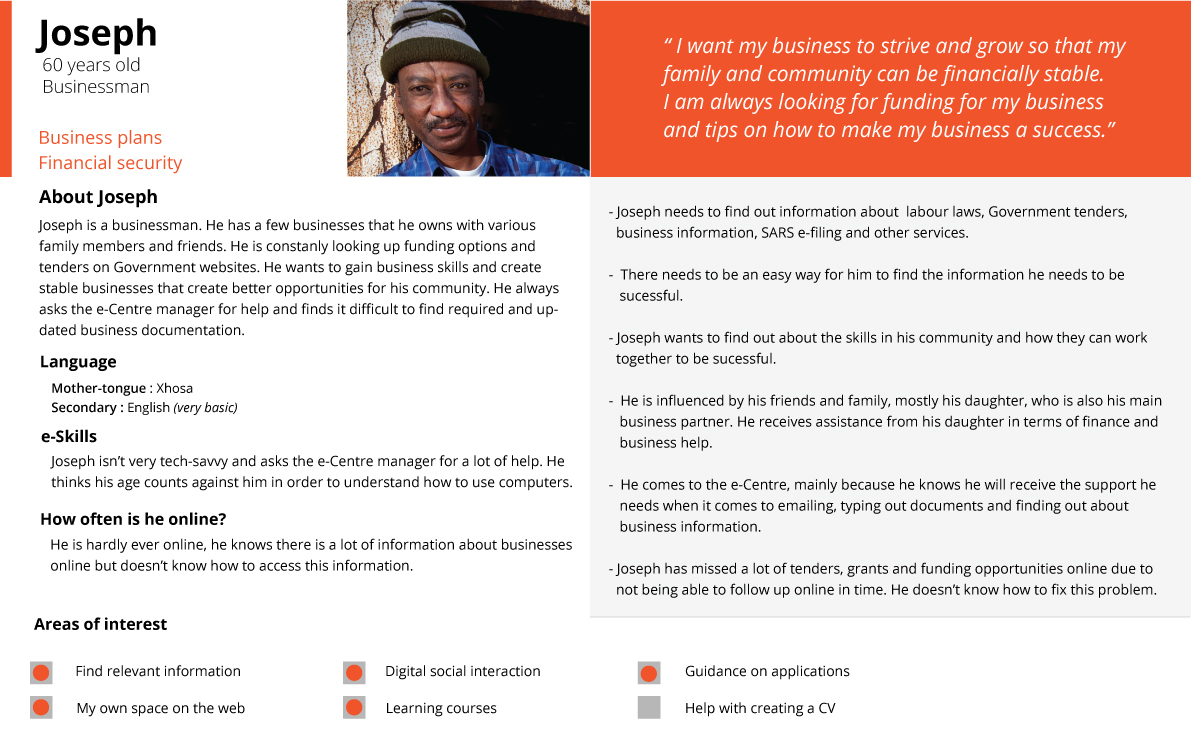
9. The businessman reported that he comes to the e-Centre almost every morning and sometimes holds meetings at the centre.
10. Some members said had reported that this e-Centre has made a big difference in their community, and helped them in their lives.

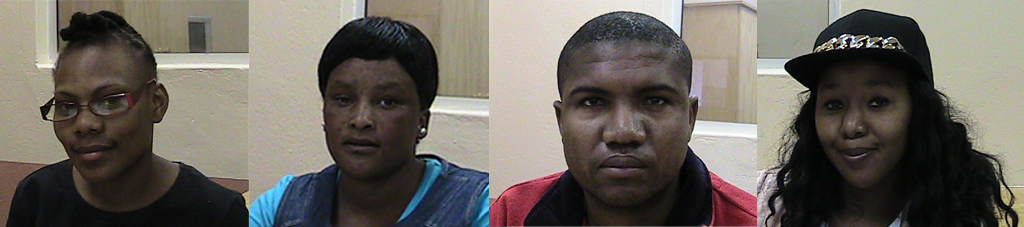
On the second day I interviewed another 8 members. I interviewed one pair and 6 individuals (2 females and 4 males). The profiles of the participants consisted of 2 matric students, 4 unemployed members, 1 factory worker and 1 businessman.
blog-zolani1

blog-zolani2


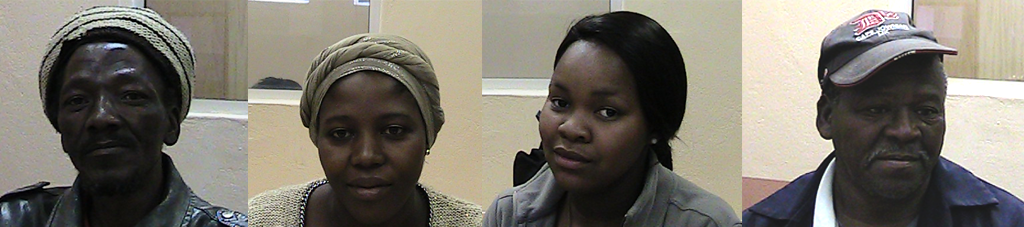
There were similar results that were reported on the third research day. Some new areas were also revealed, such as:

1. Some participants said that they don’t have a place to keep all their digital information.
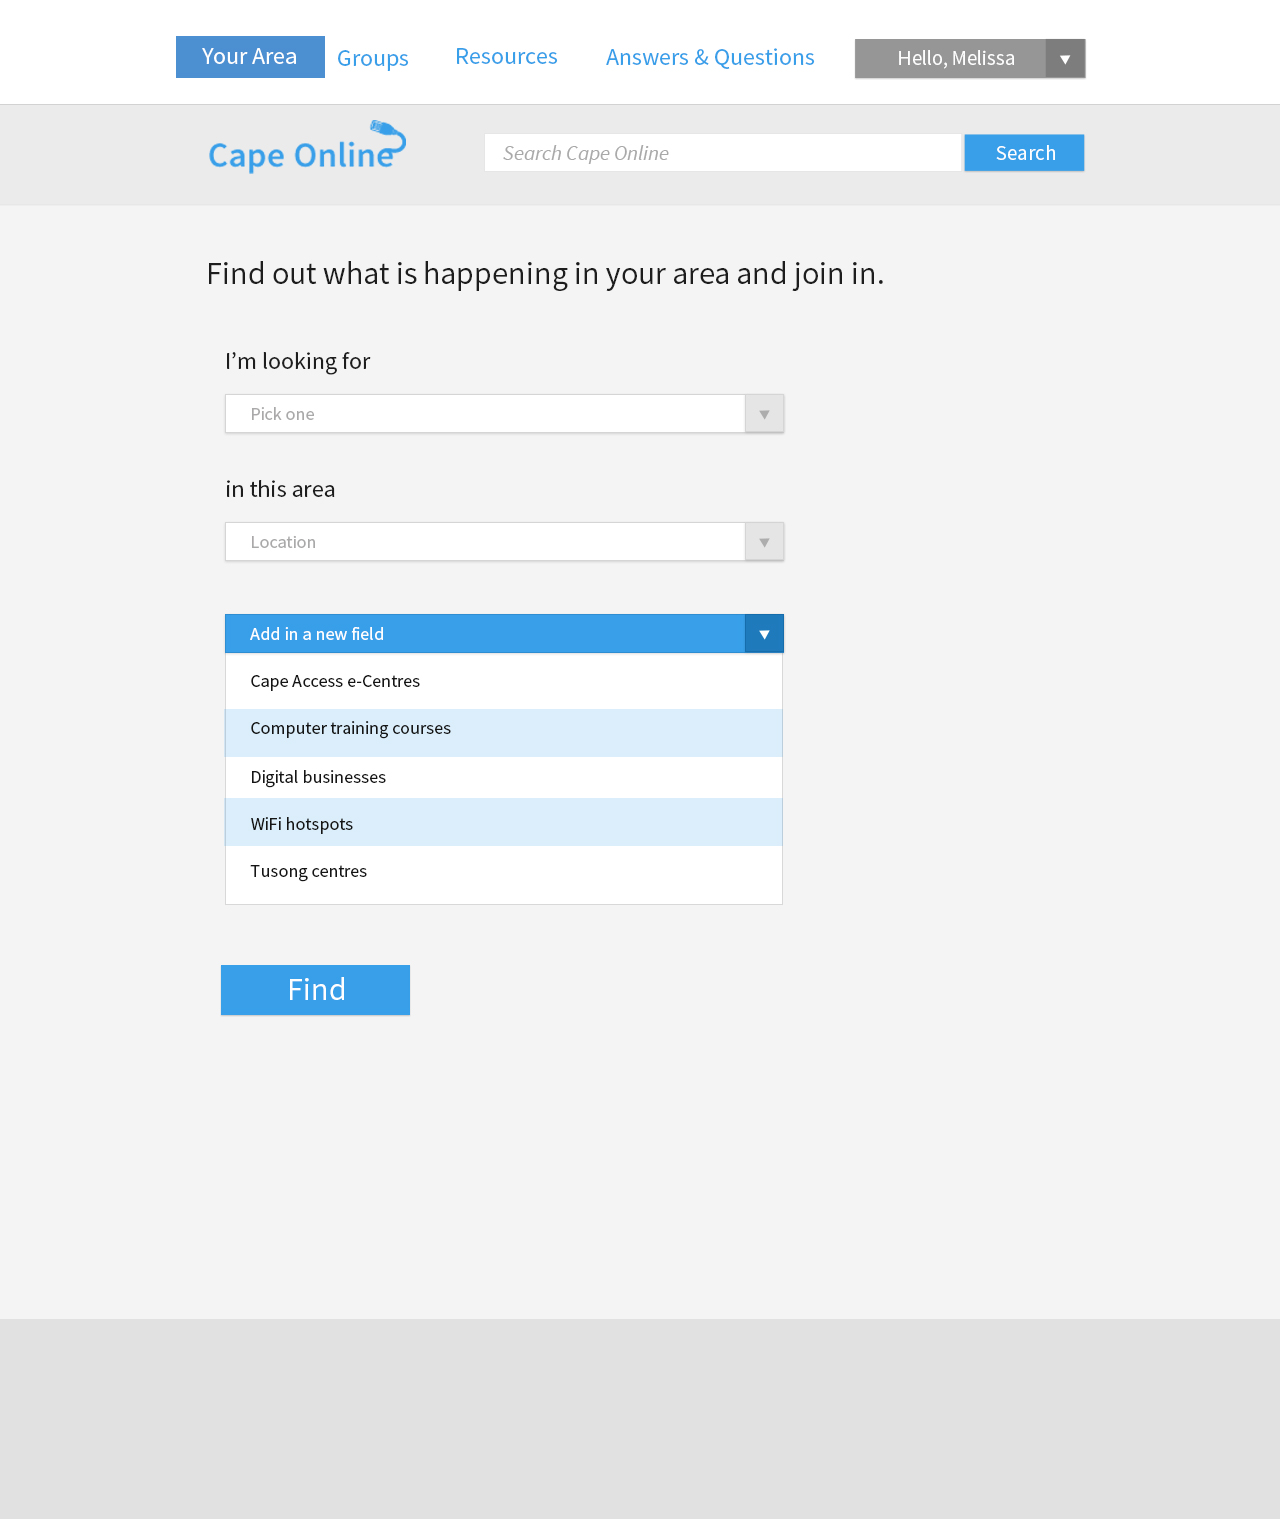
2. A few participants had asked if there was a way in which they could learn in their own time. the unemployed members were very focused on enhancing their digital skills and utilising their time to get skilled but didn’t know where to look.
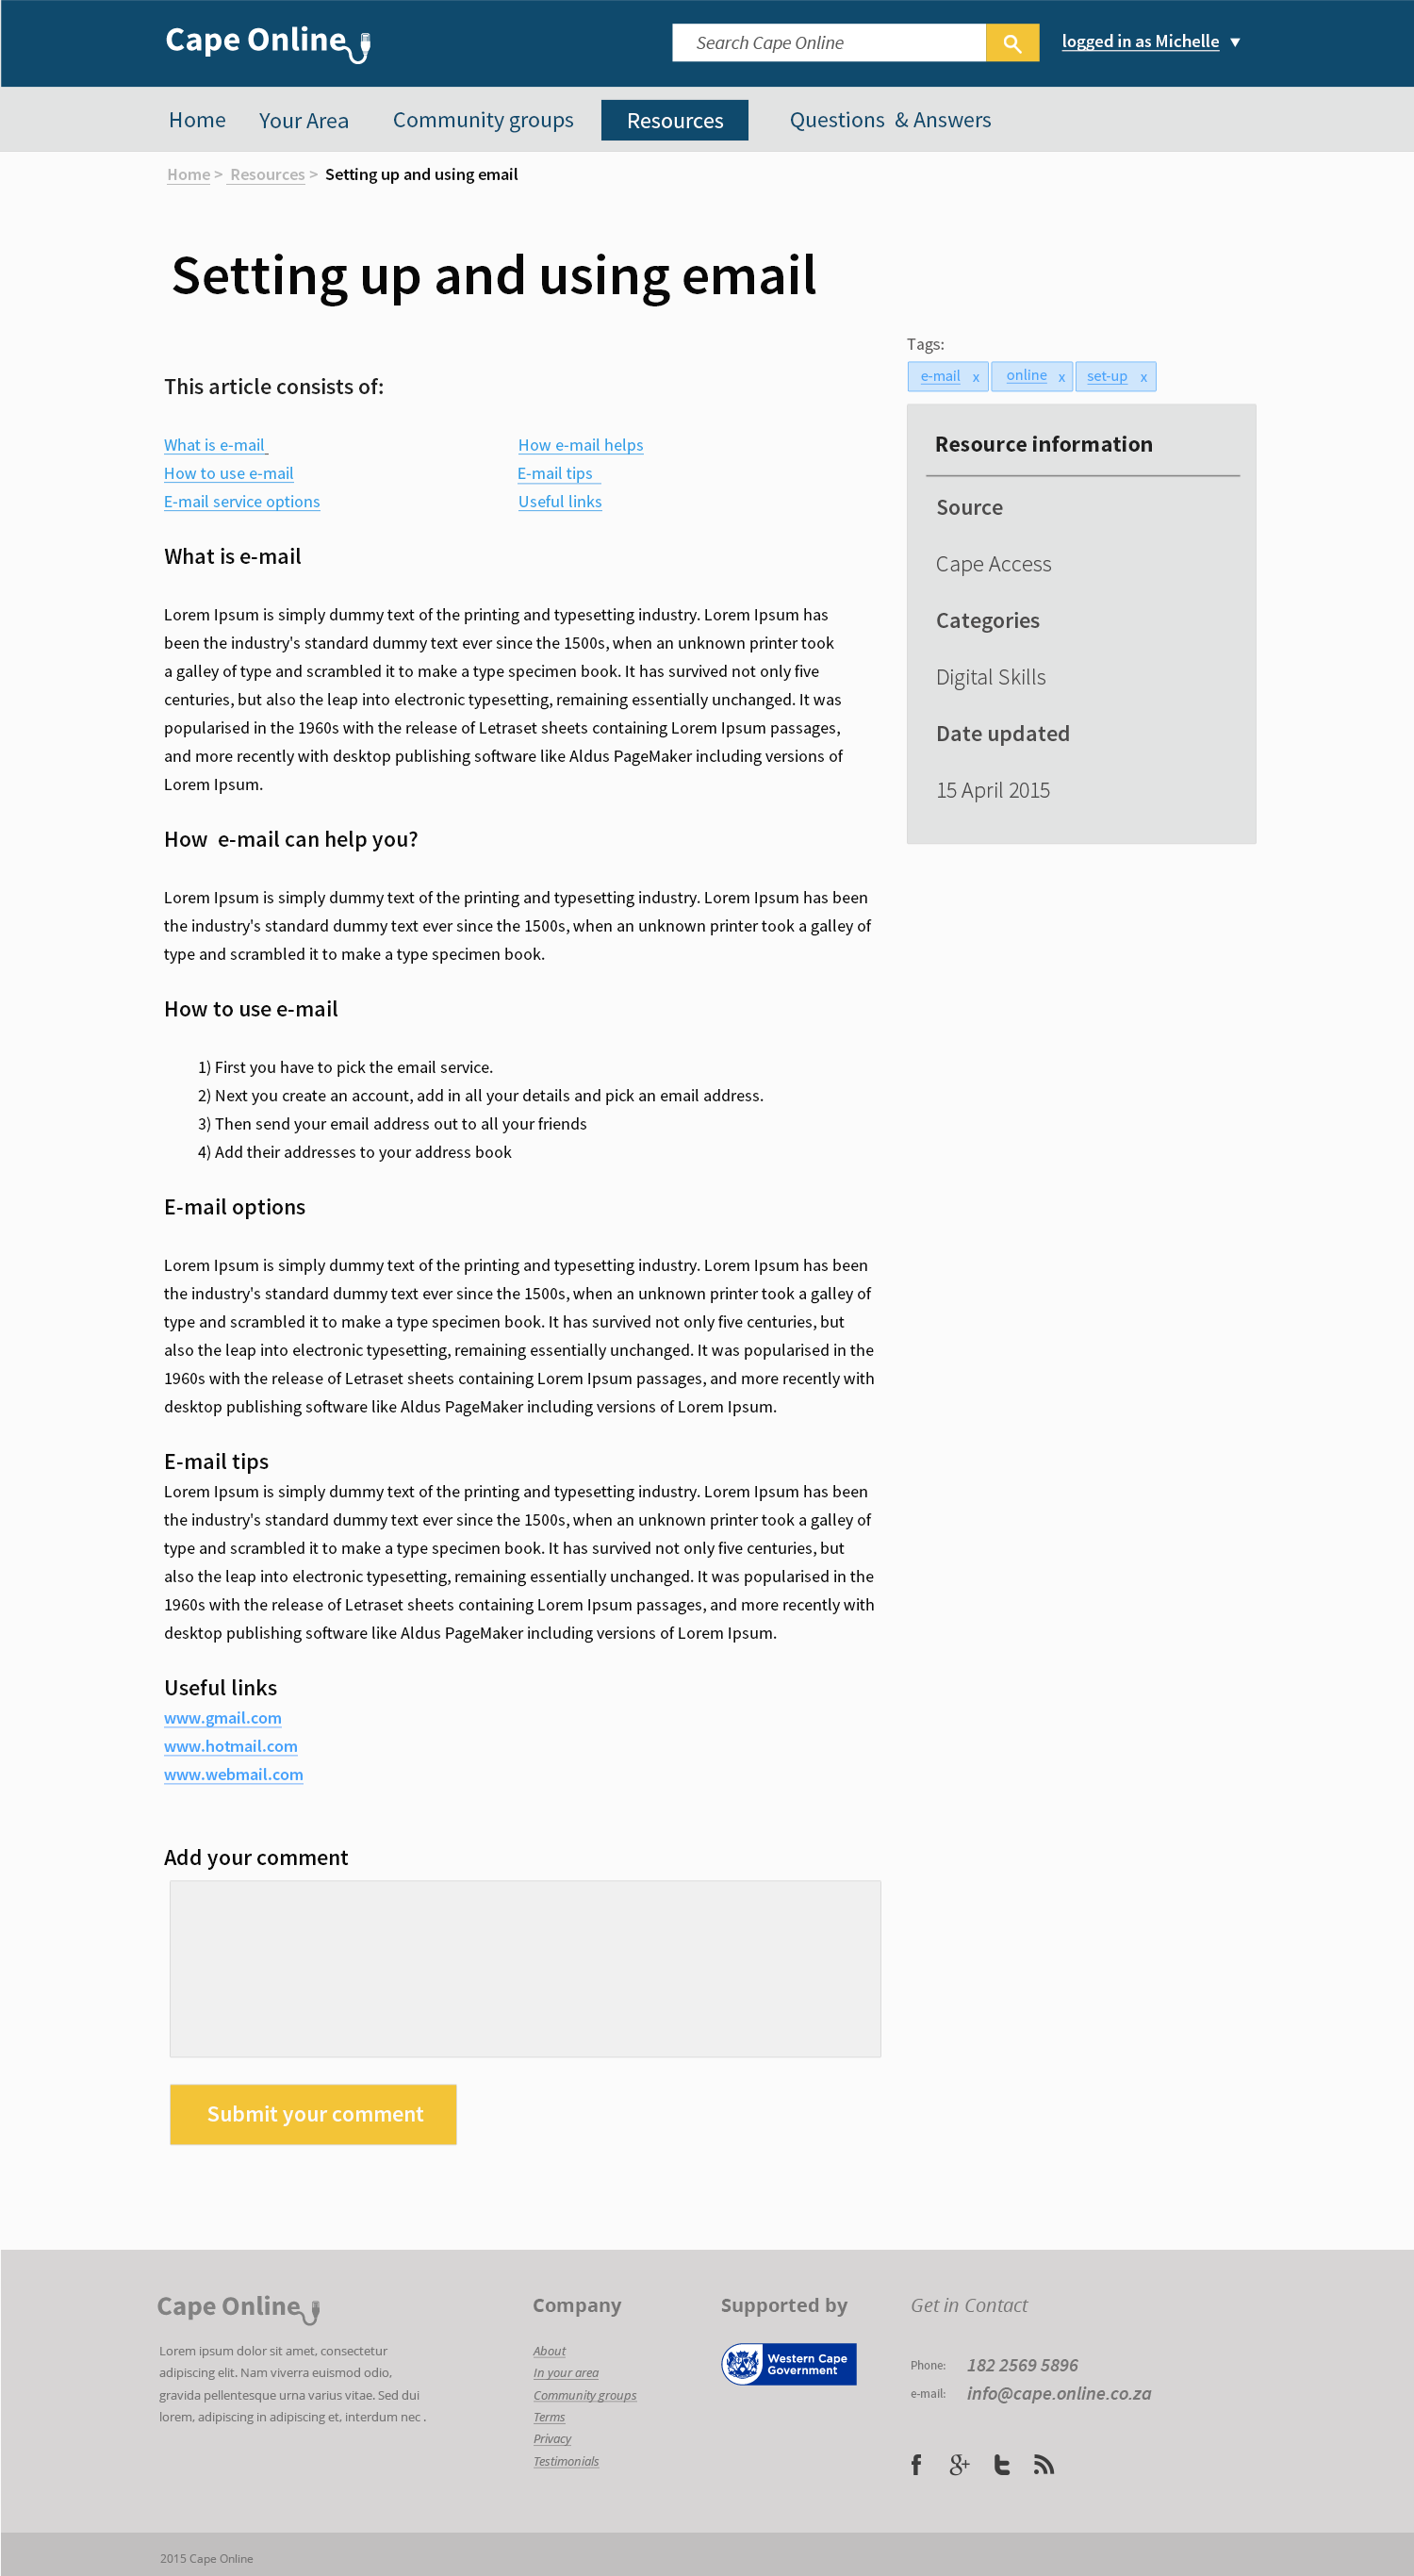
3. 3 members did not have email addresses or Facebook accounts and had reported that they wanted to get them but haven’t found out how to create them yet.